|

NZD/USD Price Analysis: Prods golden Fibonacci ratio to refresh YTD low near 0.5900

  • NZD/USD takes offers to refresh yearly low during eight-day downtrend.
  • Oversold RSI, key technical levels can challenge Kiwi bears.
  • Corrective bounce can aim for May’s bottom but remains elusive below 0.6045.

NZD/USD bears keep the reins for the eighth consecutive day as they refresh the yearly low to 0.5902 amid early Thursday.

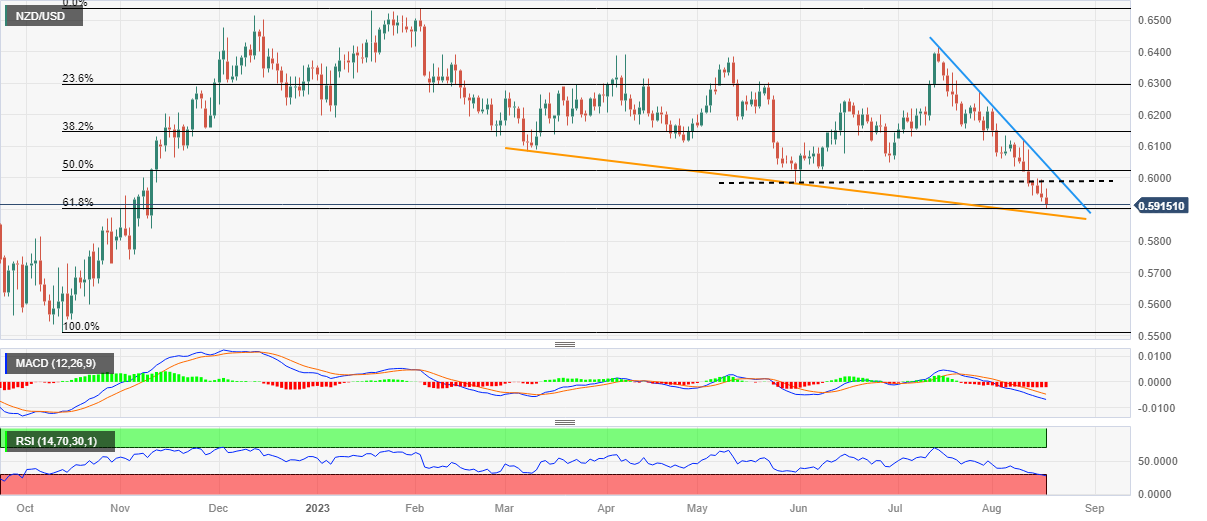
In doing so, the Kiwi pair justifies the previous week’s downside break of the 0.5985 support comprising May’s low while poking the 61.8% Fibonacci retracement of October 2022 to February 2023 upside, near 0.5900 by the press time, also known as the golden Fibonacci ratio.

It’s worth noting, however, that the RSI (14) line hits the oversold territory and joins the key Fibonacci support around 0.5900 to challenge the NZD/USD bears.

Also acting as a downside filter is a descending support line from early March, close to 0.5885 by the press time.

In a case where the Kiwi pair drops below 0.5885, the early October swing high near 0.5815 may act as the final defense of the bulls.

Alternatively, an upside clearance of the support-turned-resistance line surrounding 0.5985, closely followed by the 0.6000 psychological magnet, becomes necessary for the NZD/USD buyers to return to the desk.

Even so, a downward-sloping resistance line from July 14, around 0.6045 at the latest, can challenge the run-up before pushing back the bears.

NZD/USD: Daily chart

Trend: Limited downside expected

Additional important levels

Overview
Today last price0.5914
Today Daily Change-0.0023
Today Daily Change %-0.39%
Today daily open0.5937
 
Trends
Daily SMA200.6103
Daily SMA500.6158
Daily SMA1000.6176
Daily SMA2000.6234
 
Levels
Previous Daily High0.5994
Previous Daily Low0.5926
Previous Weekly High0.6118
Previous Weekly Low0.5974
Previous Monthly High0.6413
Previous Monthly Low0.612
Daily Fibonacci 38.2%0.5952
Daily Fibonacci 61.8%0.5968
Daily Pivot Point S10.5911
Daily Pivot Point S20.5884
Daily Pivot Point S30.5843
Daily Pivot Point R10.5979
Daily Pivot Point R20.602
Daily Pivot Point R30.6047

Author

Anil Panchal

Anil Panchal

FXStreet

Anil Panchal has nearly 15 years of experience in tracking financial markets. With a keen interest in macroeconomics, Anil aptly tracks global news/updates and stays well-informed about the global financial moves and their implications.

More from Anil Panchal
Share:

Editor's Picks

EUR/USD rebounds from session lows, stays below 1.1650

EUR/USD is recovers modestly from session lows but remains in the red below 1.1650 in European trading on Thursday. The pair faces headwinds from a renewed uptick in the US Dollar amid a negative shift in risk sentiment. Surging energy prices due to the Middle East war keep the bearish pressure intact on the Euro. The US Jobless Claims data are next of note. 

GBP/USD stays weak near 1.3350 amid UK stagflation risks

GBP/USD sticks to losses near 1.3350 in the European session on Thursday. The Pound Sterling loses ground amid fears that the United Kingdom economy could face stagflation risks due to higher energy prices, while the US Dollar attracts fresh havem demand ahead of the US Jobless Claims data. 

Gold climbs near $5,200 as Iran war fuels safe-haven demand

Gold price extends its gains for the second successive session on Thursday as traders seek safety amid the ongoing war in the Middle East. US and Israeli strikes across Iranian territory and widespread Iranian missile and drone retaliation across the Middle East, including attacks on regional targets and military sites, prolong the crisis and its impact.

Three reasons to be bearish on Bitcoin

Bitcoin is holding up well taking into account the uncertainty stemming from the Middle East. Despite this week’s rally, the long-term outlook remains bearish. Here are three reasons why I think the storm for the largest cryptocurrency isn't over yet.

Markets attempt to rally on positive news from Iran

There’s been an abrupt change in sentiment this morning, European stock markets are higher and oil and gas prices are moderating, after comments from Iran’s deputy minister about pre-conflict talks between Iran and the US.

Cardano Price Analysis: Approaches key trendline amid bearish sentiment

Cardano (ADA) price is approaching its descending trendline around $0.28 at the time of writing, set to shape the next directional move. The derivatives metrics paint a bearish picture, with ADA’s Open Interest continuing to fall and short bets rising among traders.