|

NZD/USD Price Analysis: Posts fresh 10-week high near 0.6160 on China’s fresh stimulus

  • NZD/USD strengthens on weak US Dollar and China’s announcement of stimulus to revive property sector.
  • Market speculation for Fed reducing interest rates from September has weakened.
  • NZD/USD approaches the crucial resistance of 0.6220.

The NZD/USD pair refreshes its 10-week high at 0.6165 in Tuesday’s European session. The Kiwi asset strengthens on multiple tailwinds such as soft US Dollar and China’s announcement of fresh stimulus measures to boost demand for its beleaguered housing sector.

The US Dollar Index (DXY), which tracks the US Dollar’s value against six major currencies, has extended its downside to 104.50. The US Dollar fails to capitalize on diminished expectations over the Federal Reserve (Fed) starting to reduce interest rates from the September meeting. The decline in market speculation for Fed rate cuts in September is the outcome of a strong United States (US) economic outlook and policymakers’ hawkish stance on the interest rate outlook.

Meanwhile, the New Zealand Dollar strengthened after China’s Shanghai announced several measures to revive the housing sector from the crisis. The administration acknowledges cutting down payment requirements, lowering minimum mortgage rates, and restrictions on home purchases will be eased. Being a proxy to China’s economy, the appeal for the New Zealand Dollar improves.

On the domestic front, investors await the NZ Budget Release that will indicate the scale of spendings, borrowing and revenue collection by the government.

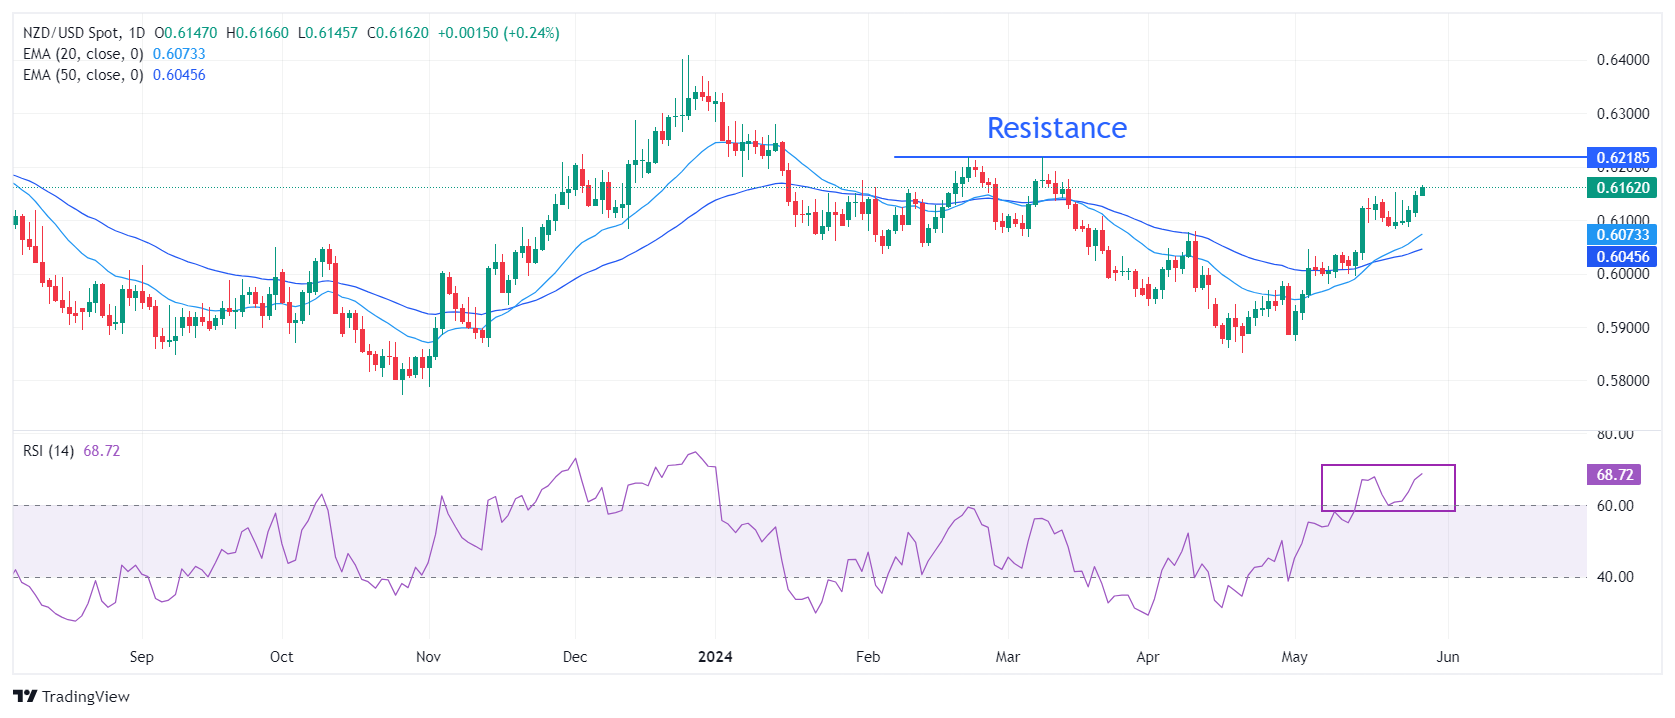
NZD/USD is approaching the horizontal resistance plotted from February 22 high around 0.6220. The Kiwi asset strengthened after a bullish crossover of the 20 and 50-day Exponential Moving Averages (EMAs) around 0.6020, which suggested that a bullish trend has been triggered.

The 14-period Relative Strength Index (RSI) shifts comfortably into the bullish range of 60.00-80.00, indicating that the momentum has leaned toward the upside.

An upside move above the round-level resistance of 0.6200 will drive the asset January 15 high near 0.6250, followed by January 12 high near 0.6280.

On the contrary, fresh downside would appear if the asset breaks below April 4 high around 0.6050 This would drag the asset towards the psychological support of 0.6000 and April 25 high at 0.5969.

NZD/USD daily chart
NZD/USD

Overview
Today last price0.616
Today Daily Change0.0013
Today Daily Change %0.21
Today daily open0.6147
 
Trends
Daily SMA200.6047
Daily SMA500.6004
Daily SMA1000.6069
Daily SMA2000.6044
 
Levels
Previous Daily High0.6155
Previous Daily Low0.6106
Previous Weekly High0.6153
Previous Weekly Low0.6083
Previous Monthly High0.6079
Previous Monthly Low0.5851
Daily Fibonacci 38.2%0.6136
Daily Fibonacci 61.8%0.6125
Daily Pivot Point S10.6117
Daily Pivot Point S20.6087
Daily Pivot Point S30.6068
Daily Pivot Point R10.6166
Daily Pivot Point R20.6185
Daily Pivot Point R30.6215

Author

Sagar Dua

Sagar Dua

FXStreet

Sagar Dua is associated with the financial markets from his college days. Along with pursuing post-graduation in Commerce in 2014, he started his markets training with chart analysis.


More from Sagar Dua
Share:

Editor's Picks

GBP/USD stays below 1.3400 after soft UK CPI data

GBP/USD struggles to gain traction and stays below 1.3400 in the second half of the day on Wednesday. The UK annual Consumer Price Index (CPI) inflation cooled to 2.6% in June against the market forecast of 2.7%, making it difficult for the British Pound gather recovery momentum. Meanwhile, investors keep a close eye on headlines coming out of the Middle East.

EUR/USD stabilizes near 1.1400 as markets focus on geopolitics

EUR/USD trades in a narrow channel at around 1.1400 on Wednesday. In the absence of high-impact data releases, escalating geopolitical tensions in the Middle East caps the pair's upside. On Thursday, the European Central Bank (ECB) will announce monetary policy decisions.

Gold holds gains above $4,100 undaunted by risk-off markets

Gold extends gains for the fourth consecutive day, standing comfortably above $4,100, unfazed by the risk-off market amid rising tensions in Iran and higher Oil prices. The pair has rallied nearly 2.5% so far this week and is on track for its best weekly performance in more than three months.

Cardano: Short-term recovery lacks retail support

Cardano price edges lower after the 50-day Exponential Moving Average at $1.770 capped two consecutive days of recovery seen earlier this week. ADA futures point to waning retail traction as Open Interest and trading volume decline amid elevated long liquidations. The technical outlook for ADA is bearish, as momentum remains subdued below a resistance trendline near $0.1782.

Chip stocks are more volatile than Oil

I continue to start the day by looking at these two charts: US crude & Kospi. The former is extending gains, trading above $86 per barrel for WTI and $92 per barrel for Brent, while the Kospi is up more than 4.5%, led higher by Korean chipmakers following a similar jump in VanEck's Semiconductor ETF yesterday.

US Dollar mid-year outlook: Exceptional currency, exceptional risks?
The US Dollar enters the second half of 2026 in a markedly different position from a year ago. The King currency has recovered, reflecting persistent US inflation, changing expectations for Fed policy, geopolitical tensions and renewed demand for defensive assets.















