|

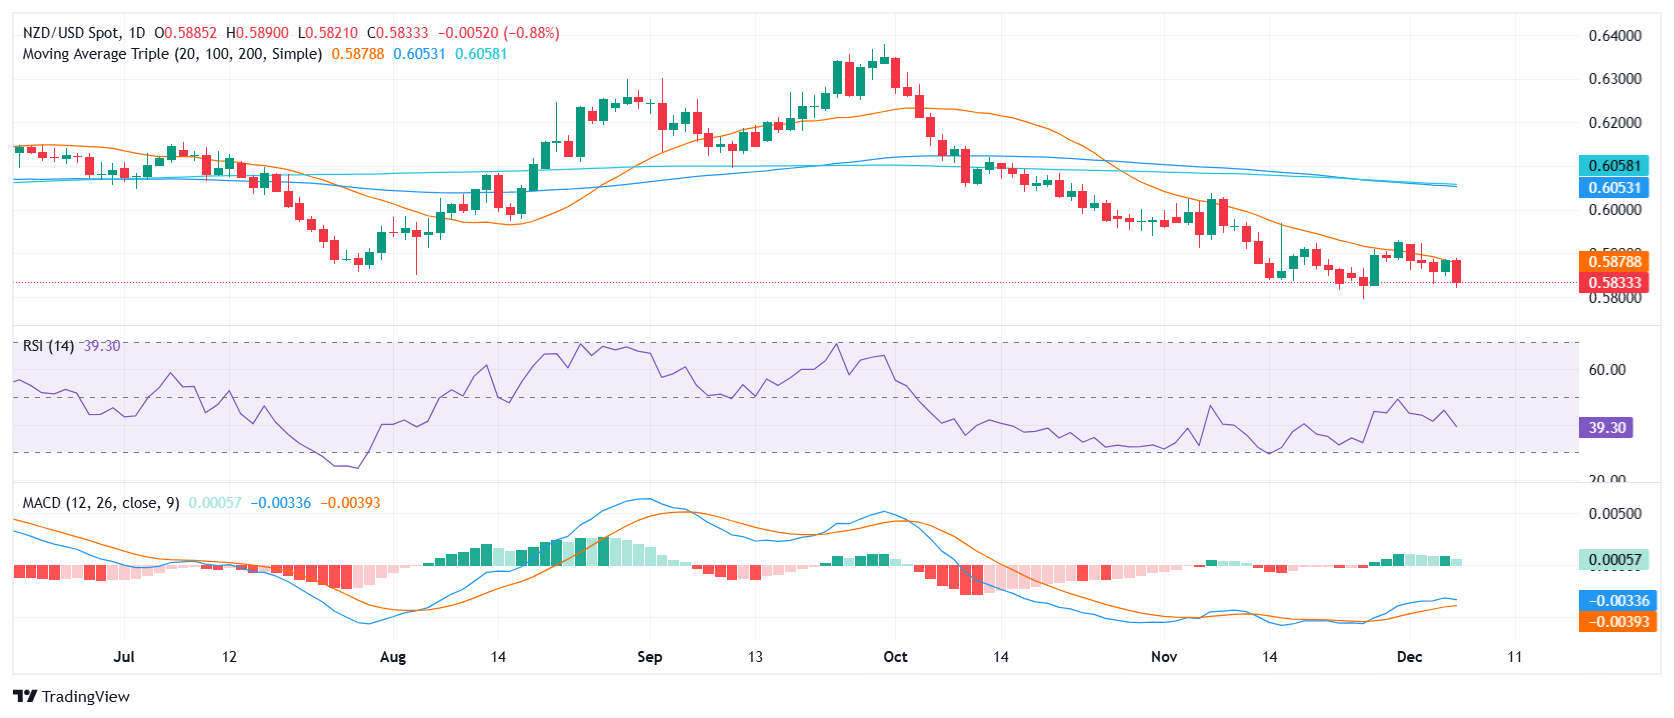
NZD/USD Price Analysis: Pair plunges to 0.5830 after rejection at 20-day SMA

  • NZD/USD drops sharply on Friday, settling around 0.5830.
  • Pair faces strong resistance at the 20-day SMA, which remains unbroken.
  • Indicators show weakening buying traction, reinforcing the bearish outlook.

The NZD/USD pair extended its decline on Friday, plunging to 0.5830 after failing to break above the 20-day Simple Moving Average (SMA). This key technical level continues to act as a formidable resistance, preventing a bullish recovery and leaving the pair under significant selling pressure.

Technical indicators reflect the loss of bullish momentum. The Relative Strength Index (RSI) shows a falling trajectory, staying in negative territory, signaling weakening buying traction. Meanwhile, the Moving Average Convergence Divergence (MACD) displays a shrinking histogram with fading green bars, indicating a slowdown in bullish momentum and reinforcing the bearish sentiment.

For now, the outlook remains decidedly bearish, with the 20-day SMA serving as a critical barrier for any upside attempts. Should the selling pressure persist, the pair may target further declines towards the 0.5800 psychological level. On the upside, a decisive break above the 20-day SMA, currently near 0.5880, is necessary to shift momentum in favor of the bulls.

NZD/USD daily chart

Author

Patricio Martín

Patricio is an economist from Argentina passionate about global finance and understanding the daily movements of the markets.

More from Patricio Martín
Share:

Markets move fast. We move first.

Orange Juice Newsletter brings you expert driven insights - not headlines. Every day on your inbox.

By subscribing you agree to our Terms and conditions.

Editor's Picks

EUR/USD tests 1.1800, closes in on a fresh two-month high

EUR/USD extends its gains for the second consecutive day on Tuesday and trades near 1.1800. The broad-based US Dollar weakness and a potential policy divergence between the European Central Bank and the Federal Reserve keep the bullish bias intact heading into the holiday season.

GBP/USD climbs above 1.3500 area, renews 11-week peak

GBP/USD extends its weekly rally and trades at its highest level since early October above 1.3500. The US Dollar remains under persistent bearish pressure heading into the Christmas break, while Pound traders largely brush off the latest interest rate cut from the Bank of England.

Gold approaches $4,500 as record-setting rally continues

Gold builds on Monday's impressive gains and advances toward $4,500, setting fresh record-highs along the way. Heightened geopolitical tensions, combined with the ongoing US Dollar (USD) selloff ahead of the Q3 GDP data, help XAU/USD preserve its bullish momentum.

US GDP expected to highlight steady growth in Q3

The United States Bureau of Economic Analysis (BEA) will publish the first preliminary estimate of the third-quarter Gross Domestic Product on Tuesday, at 13:30 GMT. Analysts expect the data to show annualized growth of 3.2%, following the 3.8% expansion in the previous quarter.

Ten questions that matter going into 2026

2026 may be less about a neat “base case” and more about a regime shift—the market can reprice what matters most (growth, inflation, fiscal, geopolitics, concentration). The biggest trap is false comfort: the same trades can look defensive… right up until they become crowded.

XRP steadies above $1.90 support as fund inflows and retail demand rise

Ripple (XRP) is stable above support at $1.90 at the time of writing on Monday, after several attempts to break above the $2.00 hurdle failed to materialize last week. Meanwhile, institutional interest in the cross-border remittance token has remained steady.