|

NZD/USD Price Analysis: Pair logs three consecutive losses, RSI oversold

  • NZD/USD declines 0.65% during Thursday's session.
  • The pair resumed downturn and printed fresh multi-month lows as bears extended the control.
  • The NZD/USD RSI slipped into oversold territory after falling below 30, indicating rising selling pressure.

The NZD/USD pair declined by 0.65% during Thursday's session and fell below the 0.5900 mark, extending declines for the sixth day and hitting lows since November 2023. The bearish momentum escalated and oversold signals emerged.

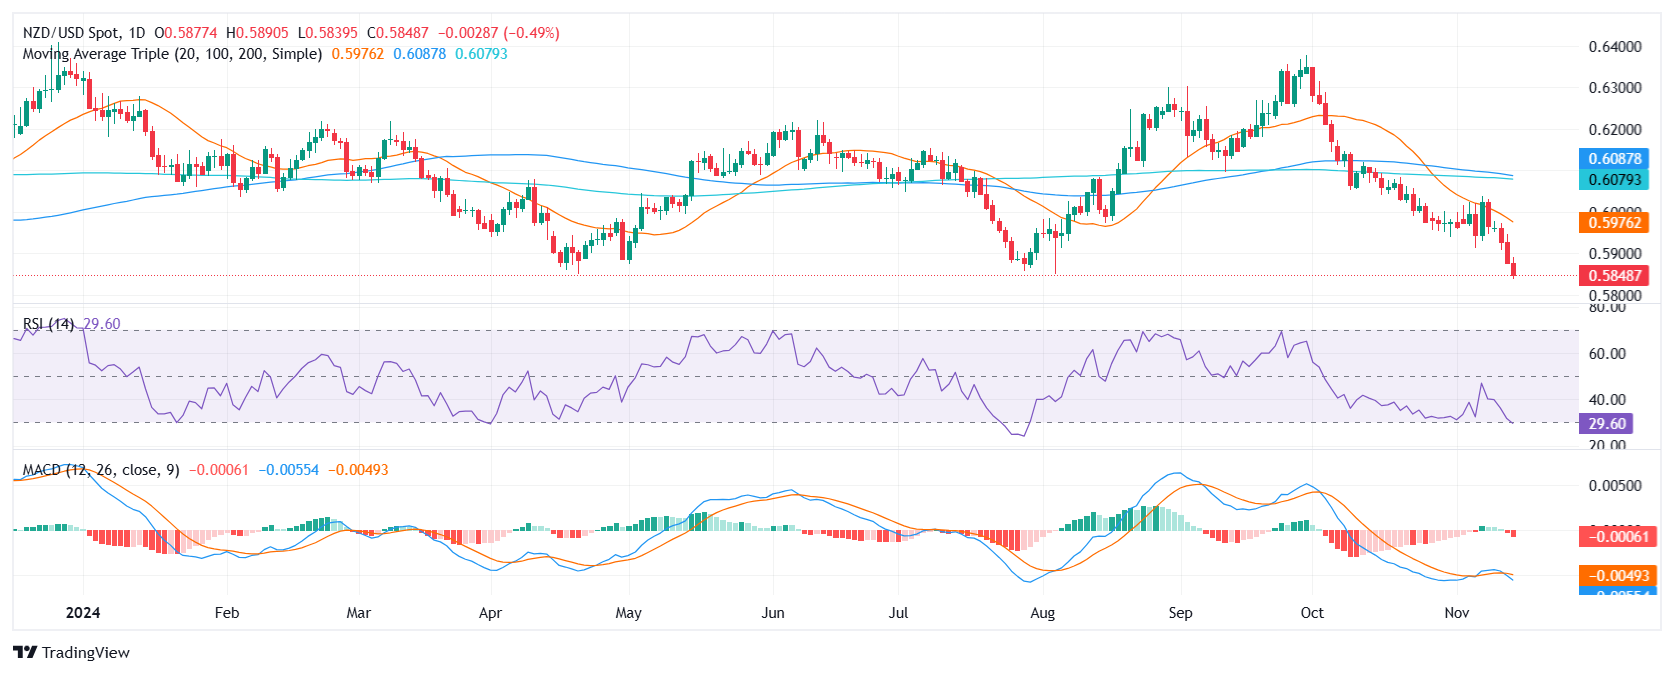
The NZD/USD pair's bearish sentiment is reinforced by technical indicators. The Relative Strength Index (RSI) has slipped below 30, indicating oversold territory and rising selling pressure. The declining slope of the RSI suggests that this pressure is intensifying. Furthermore, the Moving Average Convergence Divergence (MACD) remains bearish, with the histogram declining and red. These indicators align with the price action, confirming the pair's downward trajectory.

Support levels are at 0.5830, 0.5810, and 0.5800, while resistance levels are at 0.5900, 0.5950, and 0.5970. Traders should monitors these levels in case the oversold nature of the movements push the pair into a consolidation mode.

NZD/USD daily chart

Author

Patricio Martín

Patricio is an economist from Argentina passionate about global finance and understanding the daily movements of the markets.

More from Patricio Martín
Share:

Editor's Picks

EUR/USD loses ground below 1.1850 ahead of FOMC Minutes

The EUR/USD pair loses traction near 1.1840 during the early European session on Wednesday, pressured by renewed US Dollar demand. Traders brace for the Federal Open Market Committee Minutes for signals on future rate cuts, which will be released later on Wednesday. 

When is the UK CPI data and how could it affect GBP/USD?

The United Kingdom Consumer Price Index data for January is scheduled to be published today at 07:00 GMT. GBP/USD trades slightly lower at around 1.3556 as of writing. The 20-period Exponential Moving Average trends lower at 1.3593 and continues to cap rebounds. Price holds beneath this gauge, maintaining a short-term bearish bias.

Gold: Is the $5,000 level back in sight?

Gold snaps a two-day downtrend, as recovery gathers traction toward $5,000 on Wednesday. The US Dollar recovers from the overnight sell-off as rebalancing trades resume ahead of Fed Minutes. The 38.2% Fib support holds on the daily chart for now. What does that mean for Gold?

Pi Network rally defies market pressure ahead of its first anniversary

Pi Network is trading above $0.1900 at press time on Wednesday, extending the weekly gains by nearly 8% so far. The steady recovery is supported by a short-term pause in mainnet migration, which reduces pressure on the PI token supply for Centralized Exchanges. The technical outlook focuses on the $0.1919 resistance as bullish momentum increases.

UK jobs market weakens, bolstering rate cut hopes

In the UK, the latest jobs report made for difficult reading. Nonetheless, this represents yet another reminder for the Bank of England that they need to act swiftly given the collapse in inflation expected over the coming months. 

Top 3 Price Prediction: Bitcoin, Ethereum, and Ripple face downside risk as bears regain control

Bitcoin, Ethereum, and Ripple remain under pressure on Wednesday, with the broader trend still sideways. BTC is edging below $68,000, nearing the lower consolidating boundary, while ETH and XRP also declined slightly, approaching their key supports.