|

NZD/USD Price Analysis: Pair extends the winning streak, trades around 0.5930

  • NZD/USD rises due to more likelihood of a dovish policy stance by the Fed in the September meeting.
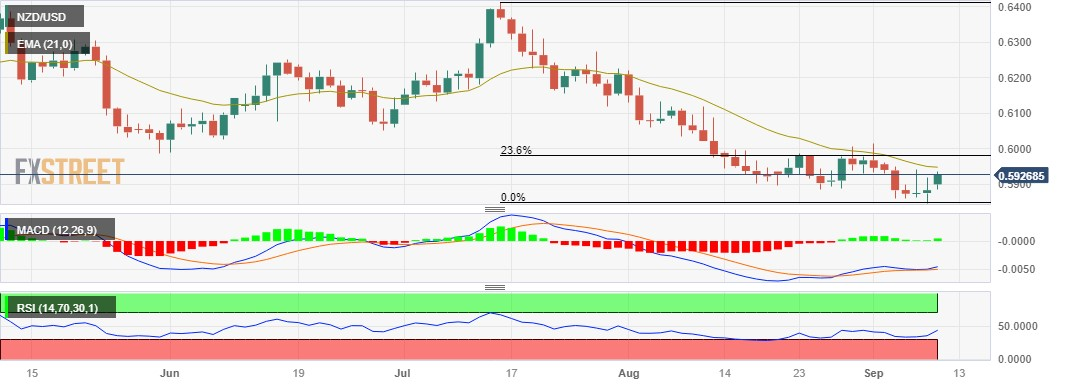
  • MACD suggests that the short-term trajectory is favoring a sideways trend.
  • The previous week’s bottom emerges as the initial support aligned to the 0.5850 psychological level.
  • The key barrier level is represented by the 21-day Exponential Moving Average (EMA) at 0.5947.

NZD/USD extends gains in the third trading session, trading higher around 0.5930 during the Asian session on Monday as a result of the retreat in the US Dollar (USD). This pair is experiencing upward support due to the reduced likelihood of the US Federal Reserve (Fed) maintaining unchanged interest rates in the upcoming September meeting.

The Moving Average Convergence Divergence (MACD) line remains below the centerline but is positioned above the signal line. This configuration suggests that the recent momentum in the market is relatively subdued and moving sideways.

The pair may encounter initial support at the previous week’s bottom at 0.5859 level lined up with the 0.5850 psychological level. A decisive break below this level could potentially lead to further downward movement, with Kiwi bears targeting the region near the 0.5800 psychological level.

On the upside, a significant resistance level for the NZD/USD pair is represented by the 21-day Exponential Moving Average (EMA) at 0.5947, which is closely aligned with the 0.5950 psychological level.

If the pair manages to break convincingly above this level, it could potentially open the door for further upward movement, with the next target being the region around the 23.6% Fibonacci retracement level at 0.5980.

In the near term, the NZD/USD pair is expected to maintain a bearish outlook as long as the 14-day Relative Strength Index (RSI) remains below the 50 level. This suggests a continued downward momentum in the pair.

NZD/USD: Daily Chart

NZD/USD: additional important levels

Overview
Today last price0.5925
Today Daily Change0.0042
Today Daily Change %0.71
Today daily open0.5883
 
Trends
Daily SMA200.593
Daily SMA500.608
Daily SMA1000.6123
Daily SMA2000.6211
 
Levels
Previous Daily High0.5919
Previous Daily Low0.5847
Previous Weekly High0.5961
Previous Weekly Low0.5847
Previous Monthly High0.6219
Previous Monthly Low0.5885
Daily Fibonacci 38.2%0.5891
Daily Fibonacci 61.8%0.5874
Daily Pivot Point S10.5847
Daily Pivot Point S20.5811
Daily Pivot Point S30.5775
Daily Pivot Point R10.5919
Daily Pivot Point R20.5955
Daily Pivot Point R30.5991

Author

Akhtar Faruqui

Akhtar Faruqui is a Forex Analyst based in New Delhi, India. With a keen eye for market trends and a passion for dissecting complex financial dynamics, he is dedicated to delivering accurate and insightful Forex news and analysis.

More from Akhtar Faruqui
Share:

Markets move fast. We move first.

Orange Juice Newsletter brings you expert driven insights - not headlines. Every day on your inbox.

By subscribing you agree to our Terms and conditions.

Editor's Picks

EUR/USD ticks lower following the release of FOMC Minutes

The US Dollar found some near-term demand following the release of the FOMC meeting minutes, with the EUR/USD pair currently piercing the 1.1750 threshold. The document showed officials are still willing to trim interest rates. Meanwhile, thinned holiday trading keeps major pairs confined to familiar levels.

GBP/USD remains sub- 1.3500, remains in the red

The GBP/USD lost traction early in the American session, maintaining the sour tone and trading around 1.3460 following the release of the FOMC meeting minutes. Trading conditions remain thin ahead of the New Year holiday, limiting the pair's volatility.

Gold stable above $4,350 as the year comes to an end

Gold price got to recover some modest ground on Tuesday, holding on to intraday gains and changing hands at $4,360 a troy ounce in the American afternoon. The bright metal showed no reaction to the release of the FOMC December meeting minutes.

Ethereum: ETH holds above $2,900 despite rising selling activity

Ethereum (ETH) held the $2,900 level despite seeing increased selling pressure over the past week. The Exchange Netflow metric showed deposits outweighed withdrawals by about 400K ETH. The high value suggests rising selling activity amid the holiday season.

Economic outlook 2026-2027 in advanced countries: Solidity test

After a year marked by global economic resilience and ending on a note of optimism, 2026 looks promising and could be a year of solid economic performance. In our baseline scenario, we expect most of the supportive factors at work in 2025 to continue to play a role in 2026.

Crypto market outlook for 2026

Year 2025 was volatile, as crypto often is.  Among positive catalysts were favourable regulatory changes in the U.S., rise of Digital Asset Treasuries (DAT), adoption of AI and tokenization of Real-World-Assets (RWA).