|

NZD/USD Price Analysis: On its way to 200-day SMA

  • NZD/USD drops to the lowest since December 18, 2019.
  • 38.2% Fibonacci retracement can offer intermediate support.
  • 21-day SMA caps short-term upside.

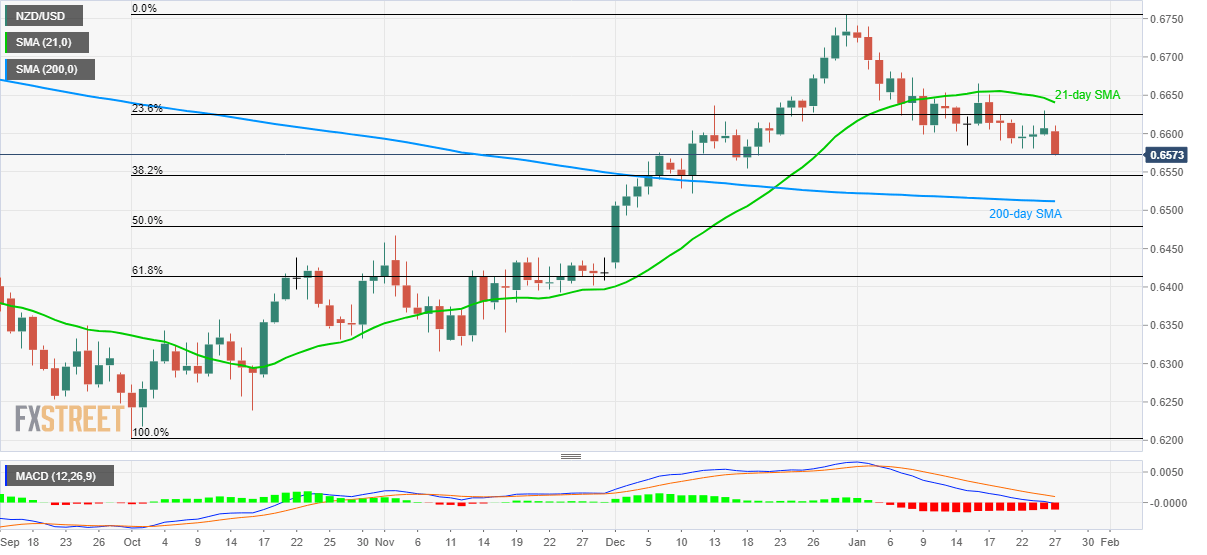
NZD/USD declines to the fresh multi-week low while flashing 0.6572 as the quote during early Monday. The pair failed to extend its latest recovery beyond 23.6% Fibonacci retracement of its October-December 2019 upside.

With this, prices are likely to keep the bears happy with 38.2% Fibonacci retracement level of 0.6545 acting as a buffer amid the fall towards a 200-day SMA level of 0.6512.

Should there be additional downpour past-0.6512, the November month top close to 0.6465 will return to the charts.

Alternatively, pair’s another attempt to cross 23.6% Fibonacci retracement level of 0.6625 can again defy the buyers unless 21-day SMA, at 0.6641 now, gets a break on the daily closing basis.

In doing so, the bulls can take aim at 0.6700 and December 31, 2019 high near 0.6755.

NZD/USD daily chart

Trend: Bearish

Additional important levels

Overview
Today last price0.6576
Today Daily Change-31 pips
Today Daily Change %-0.47%
Today daily open0.6607
 
Trends
Daily SMA200.6644
Daily SMA500.6576
Daily SMA1000.6461
Daily SMA2000.6512
 
Levels
Previous Daily High0.663
Previous Daily Low0.6598
Previous Weekly High0.663
Previous Weekly Low0.658
Previous Monthly High0.6756
Previous Monthly Low0.6424
Daily Fibonacci 38.2%0.6618
Daily Fibonacci 61.8%0.661
Daily Pivot Point S10.6593
Daily Pivot Point S20.658
Daily Pivot Point S30.6561
Daily Pivot Point R10.6625
Daily Pivot Point R20.6644
Daily Pivot Point R30.6657

Author

Anil Panchal

Anil Panchal

FXStreet

Anil Panchal has nearly 15 years of experience in tracking financial markets. With a keen interest in macroeconomics, Anil aptly tracks global news/updates and stays well-informed about the global financial moves and their implications.

More from Anil Panchal
Share:

Editor's Picks

EUR/USD holds above 1.1750 after mixed EU PMI data

EUR/USD manages to hold above 1.1750 but struggles to gather recovery momentum on Friday, following the mixed February PMI figures from Germany and the Eurozone. In the second half of the day, Q4 GDP, December inflation and February PMI data from the US will be watched closely by market participants.

GBP/USD recovers further toward 1.3500 after UK PMI data

GBP/USD is recovering ground further toward 1.3500 in European trading on Friday, helped by a modest uptick in the Pound Sterling after stronger-than-expected UK January Retail Sales and February PMI data. However, the pair's further upside could be limited amid persistent US Dollar strength as the focus turns to key US data. 

Gold sticks to positive bias above $5,000 ahead of US data

Gold gains some positive traction for the third consecutive day on Friday. holding above $5,000. Traders now look forward to the key US macro releases – the Advance Q4 GDP report and the Personal Consumption Expenditures (PCE) Price Index – for fresh trading impetus. 

US GDP growth expected to slow down significantly in Q4 after stellar Q3 

The United States Bureau of Economic Analysis will publish the first preliminary estimate of the fourth-quarter Gross Domestic Product at 13:30 GMT. Analysts forecast the US economy to have expanded at a 3% annualized rate, slowing down from the 4.4% growth posted in the previous quarter.

Iran tensions and AI fears at the forefront ahead of key US data

Thursday’s scorecard shows major US Stock benchmarks closed modestly in the red amid mounting US-Iran tensions and AI disruption worries. The S&P 500 shed 19 points (0.3%) to 6,861, the Nasdaq 100 lost 101 points (0.4%) to 24,797, and the Dow Jones Industrial Average dropped 267 points (0.5%) to 49,395.

Official Trump price approaches breakout with mixed signals from traders

Official Trump (TRUMP) is trading at $3.50 at the time of writing, approaching its upper consolidation range. A breakout from this range could open the door for an upside move. On-chain data shows market indecision, with balanced flows between bulls and bears, signaling a lack of clear directional bias.