|

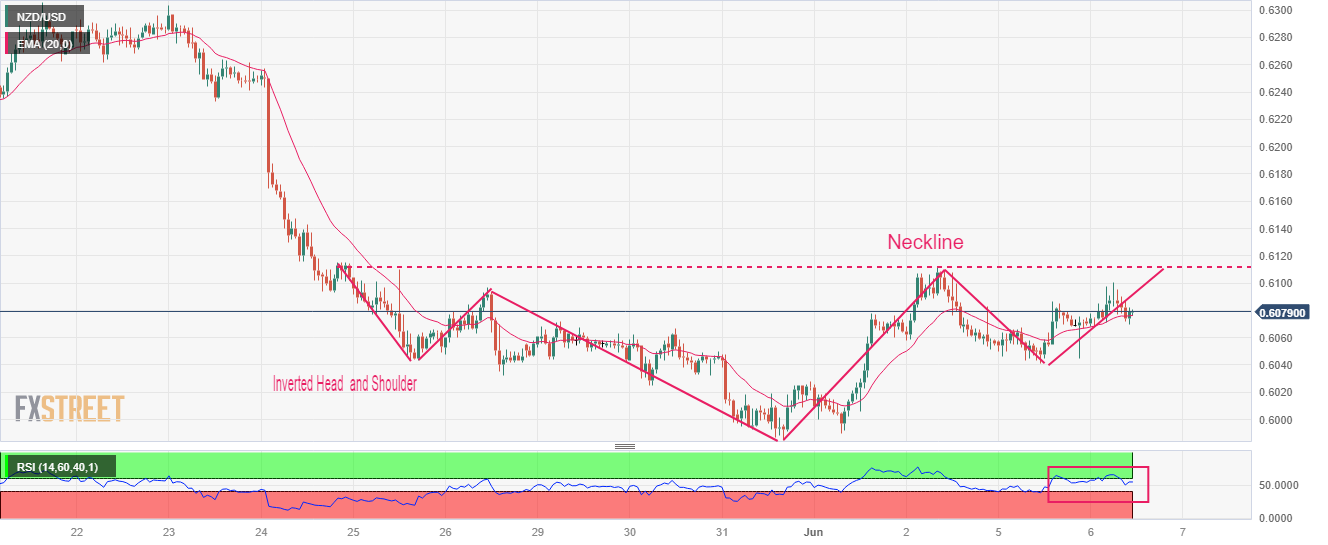
NZD/USD Price Analysis: Needs a break above 0.6100 to validate Inverted H&S formation

  • NZD/USD has attempted a recovery move after correcting to near 0.6070.
  • The street is in a tug of war between weak US economic activities and bumper employee additions in the labor market.
  • NZD/USD is forming an Inverted Head and Shoulder chart pattern whose breakout propels a bullish reversal.

The NZD/USD pair has attempted a recovery move after correcting to near 0.6070 in the London session. The Kiwi asset is expected to show volatile moves amid an absence of critical triggers.

The US Dollar Index (DXY) has extended its solid recovery to near 104.20 despite the street is mixed about interest rate policy by the Federal Reserve (Fed) for June’s meeting. The street is in a tug of war between weak economic activities and bumper employee additions in the labor market.

Meanwhile, world’s second largest economy has asked its biggest banks to slash down deposit rates in order to boost the economic prospects. Higher liquidity flush into the economy would allow firms to utilize their full capacity. It is worth noting that New Zealand is one of the leading trading partners of China and higher factor and service activities in China will support the New Zealand Dollar.

NZD/USD is forming an Inverted Head and Shoulder chart pattern on an hourly scale, which indicates a prolonged consolidation, and a breakout of the same results in a bullish reversal. The neckline of the aforementioned chart pattern is plotted from May 25 high at 0.6110.

The 20-period Exponential Moving Average (EMA) at 0.6076 is providing cushion to the Kiwi bulls.

Meanwhile, the Relative Strength Index (RSI) (14) is making efforts for shifting into the bullish range of 60.00-80.00. An occurrence of the same will trigger an upside momentum.

A confident break above May 25 high at 0.6110 will drive the Kiwi asset toward May 01 low at 0.6160 followed by the round-level resistance at 0.6200.

Alternatively, a downside move below the intraday low at 0.6015 will expose the asset for a fresh six-month low toward 11 November 2022 low at 0.5984. A slippage below the latter would expose the asset toward 02 November 2022 high at 0.5941.

NZD/USD hourly chart

NZD/USD

Overview
Today last price0.6078
Today Daily Change0.0009
Today Daily Change %0.15
Today daily open0.6069
 
Trends
Daily SMA200.6167
Daily SMA500.6201
Daily SMA1000.6247
Daily SMA2000.6149
 
Levels
Previous Daily High0.6086
Previous Daily Low0.6041
Previous Weekly High0.6112
Previous Weekly Low0.5985
Previous Monthly High0.6385
Previous Monthly Low0.5985
Daily Fibonacci 38.2%0.6069
Daily Fibonacci 61.8%0.6058
Daily Pivot Point S10.6044
Daily Pivot Point S20.602
Daily Pivot Point S30.5999
Daily Pivot Point R10.609
Daily Pivot Point R20.6111
Daily Pivot Point R30.6136

Author

Sagar Dua

Sagar Dua

FXStreet

Sagar Dua is associated with the financial markets from his college days. Along with pursuing post-graduation in Commerce in 2014, he started his markets training with chart analysis.

More from Sagar Dua
Share:

Markets move fast. We move first.

Orange Juice Newsletter brings you expert driven insights - not headlines. Every day on your inbox.

By subscribing you agree to our Terms and conditions.

Editor's Picks

EUR/USD moves sideways below 1.1800 on Christmas Eve

EUR/USD struggles to find direction and trades in a narrow channel below 1.1800 after posting gains for two consecutive days. Bond and stock markets in the US will open at the usual time and close early on Christmas Eve, allowing the trading action to remain subdued. 

GBP/USD keeps range around 1.3500 amid quiet markets

GBP/USD keeps its range trade intact at around 1.3500 on Wednesday. The Pound Sterling holds the upper hand over the US Dollar amid pre-Christmas light trading as traders move to the sidelines heading into the holiday season. 

Gold retreats from record highs, trades below $4,500

Gold retreats after setting a new record-high above $4,520 earlier in the day and trades in a tight range below $4,500 as trading volumes thin out ahead of the Christmas break. The US Dollar selling bias remains unabated on the back of dovish Fed expectations, which continues to act as a tailwind for the bullion amid persistent geopolitical risks.

Bitcoin slips below $87,000 as ETF outflows intensify, whale participation declines

Bitcoin price continues to trade around $86,770 on Wednesday, after failing to break above the $90,000 resistance. US-listed spot ETFs record an outflow of $188.64 million on Tuesday, marking the fourth consecutive day of withdrawals.

Economic outlook 2026-2027 in advanced countries: Solidity test

After a year marked by global economic resilience and ending on a note of optimism, 2026 looks promising and could be a year of solid economic performance. In our baseline scenario, we expect most of the supportive factors at work in 2025 to continue to play a role in 2026.

Avalanche struggles near $12 as Grayscale files updated form for ETF

Avalanche trades close to $12 by press time on Wednesday, extending the nearly 2% drop from the previous day. Grayscale filed an updated form to convert its Avalanche-focused Trust into an ETF with the US Securities and Exchange Commission.