|

NZD/USD Price Analysis: Meeting resistance and W-formation is bearish

  • NZD/USD bears are lurking from the daily resistance.
  • Weekly bulls are backing a test of the weekly resistance line. 

NZD/USD has enjoyed a burst of life from the bulls since the New Zealand inflation readings from the Asian session. This has seen the price rally parabolically but at some point, there needs to be a pullback. The following illustrates where that might come from in a daily perspective. However, there are bullish tendencies on the weekly chart that is conflicting, to some extent. 

NZD/USD daily chart

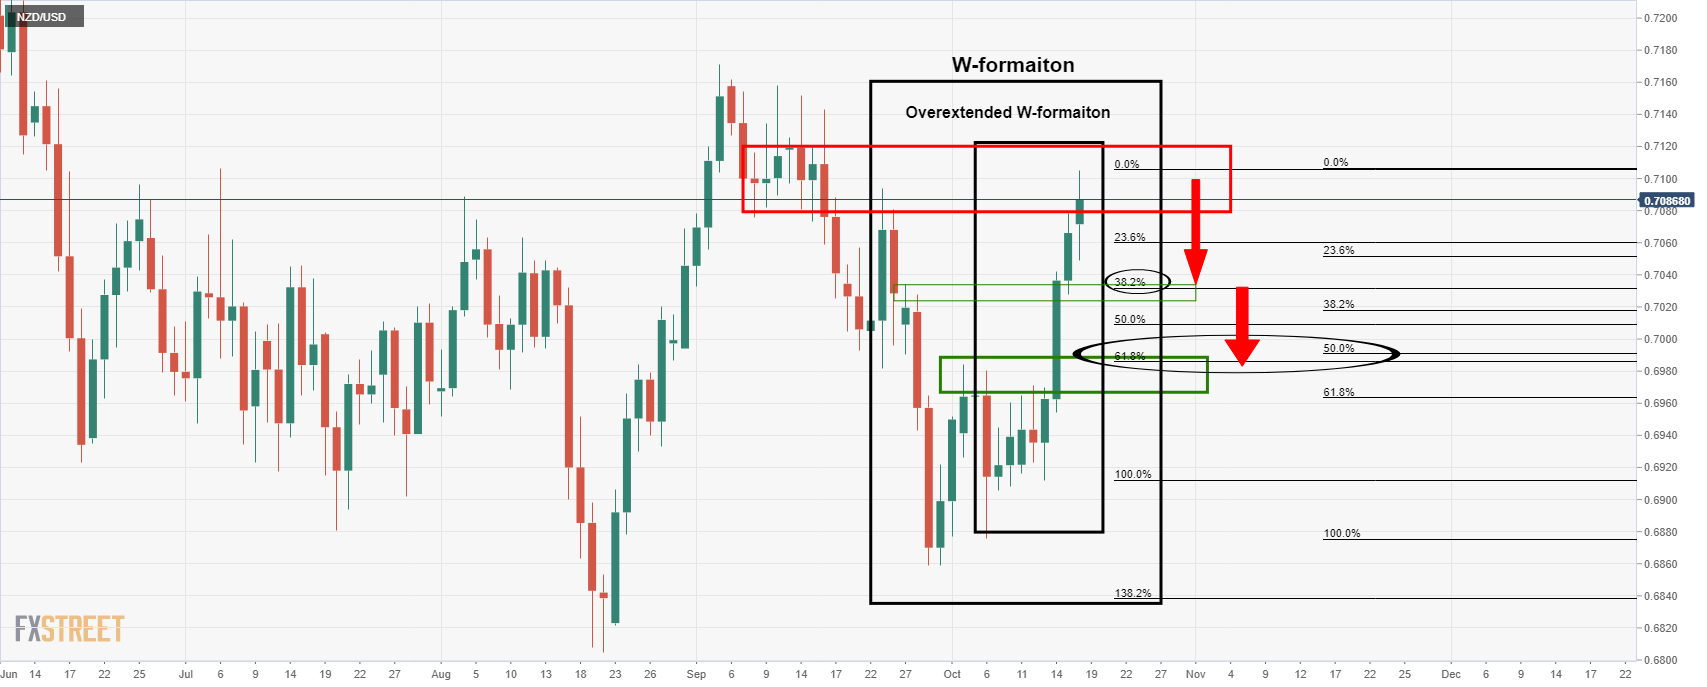
We have not one but two W-formations on the daily chart. The w-formations are a reversion pattern that has a high completion rate of the price reverting back to test the neckline of the formation. The smallest of the W-formations is highly overextended, so the price is more likely to correct only some of the recent rallies and fall short of the neckline. However, the confluence of the 50% and 61.8% Fibos is compelling as a firm area of technical demand of the price were to correct all the way to the neckline of the larger of the two W-formations (the W that is not over extended, containing the overextended within its ranges). 

NZD/USD weekly chart

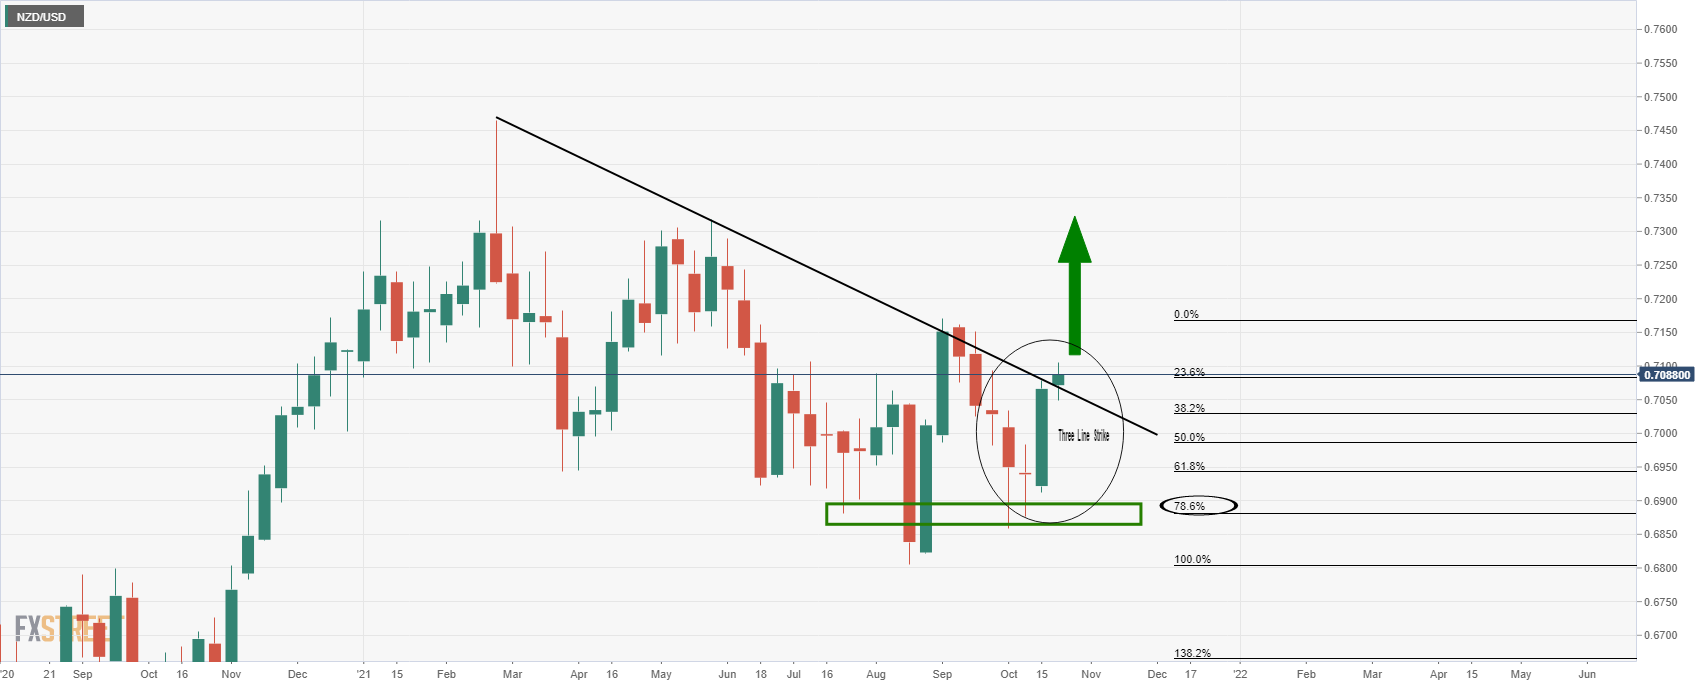
Meanwhile, from a weekly perspective, the price has corrected deeply to a 78.6% Fibonacci from trendline resistance. It then shot higher in a three-line strike as pe the bodies of the candles. In any case, the bullish engulfing rally has penetrated the resistance line so there are prospects of a breakout, in contrast to the daily chart's W-formations. 

Author

Ross J Burland

Ross J Burland, born in England, UK, is a sportsman at heart. He played Rugby and Judo for his county, Kent and the South East of England Rugby team.

More from Ross J Burland
Share:

Editor's Picks

EUR/USD looks weak below 1.1800

EUR/USD has slipped back under pressure, breaking through the 1.1800 support and drifting towards the weekly lows near 1.1770 ahead of the opening bell in Asia. The move reflects renewed strength in the US Dollar, with steady geopolitical tensions keeping its demand firm. Moving forward, the release of the German labour market report and flash inflation figures should keep European investors entertained on Friday.
 

GBP/USD threatens the 200-day SMA near 1.3440

GBP/USD rapidly leaves behind Wednesday’s strong advance, coming under heavy pressure and retesting the 1.3440 zone, where the critical 200-day SMA is located. Cable’s deep pullback follows the strong gains in the Greenback, while investors continue to pencil in a potential BoE rate cut in March.

Gold remains below $5,200 despite tariff jitters and geopolitical risks

Gold is seen consolidating in a range below the $5,200 mark during the Asian session on Friday amid mixed cues. Trade jitters, along with the risk of a potential US-Iran war, act as a tailwind for the safe-haven bullion. Meanwhile, the Fed's hawkish outlook keeps the US Dollar close to the monthly high and caps the non-yielding yellow metal. Nevertheless, the commodity remains on track to register gains for the fourth straight week, though the fundamental backdrop warrants some caution for bullish traders.

How AI, blockchain, stablecoins are shaping a new global economy – Circle CEO Jeremy Allaire

Artificial Intelligence (AI), blockchain technology and stablecoins are emerging as core pillars of a new global economic system, according to Circle’s CEO, Jeremy Allaire.

Changing the game: International implications of recent tariff developments

The Supreme Court ruling on International Emergency Economic Powers Act (IEEPA) tariffs provides limited relief for the rest of the world, with weighted average tariff rates modestly lower.

Bitcoin steadies as traders eye US–Iran talks

Bitcoin (BTC) price is stabilizing around $68,000 at the time of writing on Thursday after a 6.2% relief rally the previous day amid a broader downward trend.