|

NZD/USD Price Analysis: Kiwi bears approach 0.6000 despite improving NZ Q1 Manufacturing Sales

  • NZD/USD stays pressured at the lowest levels in a week.
  • NZ Q1 Manufacturing Sales improved from prior but slide beneath upbeat forecasts.
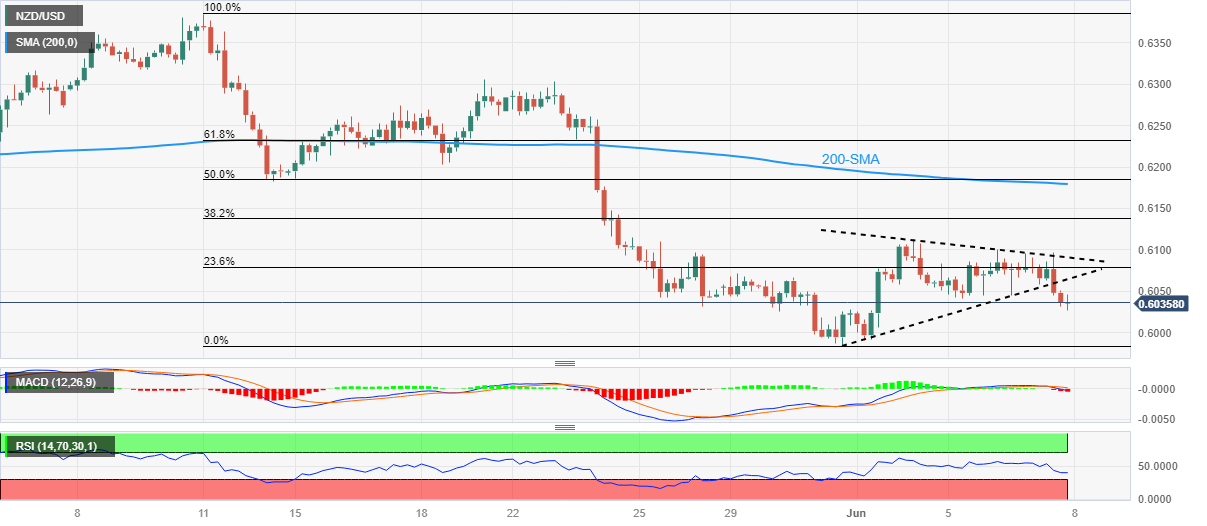
  • Clear downside break of one-week-old symmetrical triangle, bearish MACD signals suggest further fall in Kiwi price.
  • RSI conditions suggest bottom-picking around yearly low marked in the last week.

NZD/USD bears occupy the driver’s seat as the Kiwi pair remains depressed at the weekly low surrounding 0.6030 amid the early Asian session on Thursday, after falling the most in a fortnight the previous day.

In doing so, the Kiwi pair ignores the recently firmer New Zealand (NZ) data while paying more attention to the previous day’s downside break of a one-weeklong symmetrical triangle. That said, NZ Manufacturing Sales improves to -2.1% in the first quarter (Q1) of 2023 versus 3.9% expected and -4.7% prior.

It should be noted that the heaviest bearish MACD signals in nearly two weeks join the aforementioned triangle breakdown to keep the NZD/USD bears hopeful.

With this, the quote appears all set to prod the 0.6000 psychological magnet. However, the RSI (14) is below the 50.0 level and hence the yearly low marked in the last week around 0.5985 may offer an opportunity for the counter-trend traders to take the risk.

Should the quote fails to recover from 0.5985, the odds of witnessing a slump toward the early October 2022 top near 0.5815 can’t be ruled out.

On the contrary, NZD/USD recovery appears elusive unless the quote stays below the previously stated triangle formation’s bottom line, close to 0.6065 at the latest. Even so, the top of the triangle, near 0.6100, can act as an extra check for the bulls before giving them control.

Following that, a convergence of the 200-SMA and 50% Fibonacci retracement level of the pair’s May 10-31 downturn, around 0.6180, will be key to watch for the NZD/USD bulls.

NZD/USD: Four-hour chart
Trend: Limited downside expected

Additional important levels

Overview
Today last price0.6036
Today Daily Change-0.0042
Today Daily Change %-0.69%
Today daily open0.6078
 
Trends
Daily SMA200.6154
Daily SMA500.6198
Daily SMA1000.6244
Daily SMA2000.6149
 
Levels
Previous Daily High0.61
Previous Daily Low0.6045
Previous Weekly High0.6112
Previous Weekly Low0.5985
Previous Monthly High0.6385
Previous Monthly Low0.5985
Daily Fibonacci 38.2%0.6079
Daily Fibonacci 61.8%0.6066
Daily Pivot Point S10.6049
Daily Pivot Point S20.6019
Daily Pivot Point S30.5993
Daily Pivot Point R10.6104
Daily Pivot Point R20.613
Daily Pivot Point R30.616

Author

Anil Panchal

Anil Panchal

FXStreet

Anil Panchal has nearly 15 years of experience in tracking financial markets. With a keen interest in macroeconomics, Anil aptly tracks global news/updates and stays well-informed about the global financial moves and their implications.


More from Anil Panchal
Share:

Editor's Picks

AUD/USD sits near a one-month top, above 0.7000 amid fresh USD selling

AUD/USD holds above 0.7000 through the Asian session, trading near a one-month high touched earlier this Monday amid renewed US Dollar selling. US bond yields decline further amid a modest pullback in crude oil prices, capping the USD recovery from a three-week low. Moreover, bets for a November RBA rate hike support the Aussie, though upside seems capped ahead of the crucial two-day FOMC meeting, starting Tuesday.

USD/JPY struggles below 157.00 on weak USD; holds above one-month low ahead of Fed, BoJ meetings

USD/JPY attracts fresh sellers during the Asian session on Monday, stalling its recovery from the lowest level since September 18, touched Friday as a further decline in US bond yields weighs on the US Dollar. Meanwhile, the Japanese Yen benefits from a more hawkish BoJ, further weighing on the currency pair. The downside, however, seems limited as traders keenly await Fed and BoJ policy meetings later this week.

Gold sticks to modest recovery gains above $4,000 as Fed hike bets cap upside

Gold stages a modest recovery from the vicinity of a three-month low, trading above the $4,000 psychological mark through Monday’s Asian session amid a softer US Dollar. US President Donald Trump has ruled out immediate military action against Iran, triggering a modest pullback in crude oil prices. Furthermore, Federal Reserve officials have signaled no urgency to raise interest rates immediately.

Cardano's derivatives and on-chain data confirm bears in control

Cardano extends losses, trading below $0.202 after three consecutive weeks of more than 20% declines since early October. Selling pressure continues to build as weakening derivatives metrics, bearish on-chain signals and a deteriorating technical outlook point to further downside risks. Derivatives data shows a bearish bias for Cardano.

CFTC Report: WTI rally runs ahead of positioning
The week in one sentence: WTI prices surged while speculative longs were cut in the week to October 20, creating the clearest price/positioning divergence. Sterling and the Canadian Dollar led the constructive currency shift, while Yen longs also rebuilt. Speculators turned less constructive on the WTI, reducing their net exposure to around 89.3K contracts.
What November 3 means for the Fed's rate path and the US Dollar

The USD faces a decisive period ahead of the November 3 midterm elections. While markets anticipate another interest rate increase from the Fed in December, the battle for control of Congress could reshape fiscal policy expectations and, indirectly, the path of US monetary policy in 2027.