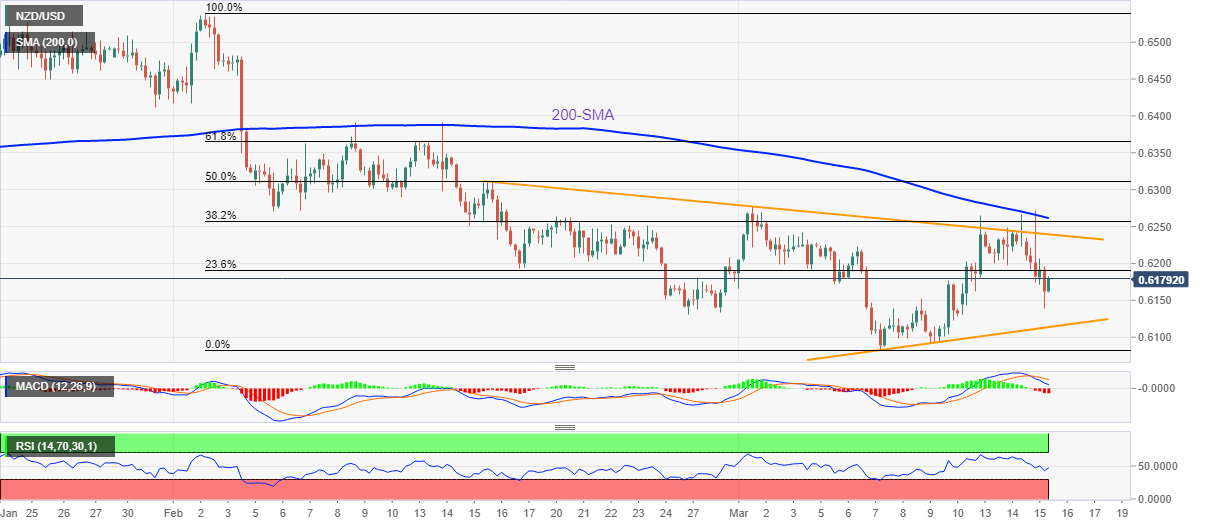
NZD/USD Price Analysis: Keeps pullback from 200-SMA below 0.620


  • NZD/USD bounces off intraday low but stays down for the second consecutive day.
  • Bearish MACD signals, downbeat RSI keeps sellers hopeful amid failures to cross 200-SMA, one-month-old resistance line.
  • Weekly ascending trend line, YTD low lures Kiwi bears.

NZD/USD picks up bids to pare intraday losses around 0.6175 during early Thursday. Even so, the Kiwi pair remains down for the second consecutive day after reversing from the 200-SMA and one-month-old resistance line the previous day.

The NZD/USD pair’s failure to cross the aforementioned key hurdles joins bearish MACD signals and the downbeat RSI (14) line, not oversold, to keep the sellers hopeful of witnessing the quote’s further downside.

As a result, an upward-sloping support line from the last Thursday, near 0.6115 at the latest, gains the attention of intraday bears ahead of the monthly low, as well as the 2023 bottom, marked around 0.6085 in the last week.

It should be noted that the NZD/USD pair’s weakness past 0.6085 will need validation from the July 2022 low of 0.6060 to aim for the 0.6000 psychological magnet, also comprising the early September 2022 bottom.

Meanwhile, the 23.6% Fibonacci retracement level of the Kiwi pair’s February-March downside, near 0.6190, precedes the 0.6200 threshold to restrict immediate NZD/USD upside.

In a case where the quote remains firmer past 0.6200, the previously mentioned resistance line from mid-February and the 200-SMA, respectively near 0.6240 and 0.6265, will be in the spotlight.

NZD/USD: Four-hour chart

Trend: Further downside expected

Additional important levels

Overview
Today last price 0.6176
Today Daily Change -0.0012
Today Daily Change % -0.19%
Today daily open 0.6188
 
Trends
Daily SMA20 0.6196
Daily SMA50 0.6315
Daily SMA100 0.6254
Daily SMA200 0.6164
 
Levels
Previous Daily High 0.6271
Previous Daily Low 0.6172
Previous Weekly High 0.6226
Previous Weekly Low 0.6084
Previous Monthly High 0.6538
Previous Monthly Low 0.6131
Daily Fibonacci 38.2% 0.621
Daily Fibonacci 61.8% 0.6233
Daily Pivot Point S1 0.615
Daily Pivot Point S2 0.6111
Daily Pivot Point S3 0.6051
Daily Pivot Point R1 0.6249
Daily Pivot Point R2 0.631
Daily Pivot Point R3 0.6348


Share: Feed news

Information on these pages contains forward-looking statements that involve risks and uncertainties. Markets and instruments profiled on this page are for informational purposes only and should not in any way come across as a recommendation to buy or sell in these assets. You should do your own thorough research before making any investment decisions. FXStreet does not in any way guarantee that this information is free from mistakes, errors, or material misstatements. It also does not guarantee that this information is of a timely nature. Investing in Open Markets involves a great deal of risk, including the loss of all or a portion of your investment, as well as emotional distress. All risks, losses and costs associated with investing, including total loss of principal, are your responsibility. The views and opinions expressed in this article are those of the authors and do not necessarily reflect the official policy or position of FXStreet nor its advertisers. The author will not be held responsible for information that is found at the end of links posted on this page.

If not otherwise explicitly mentioned in the body of the article, at the time of writing, the author has no position in any stock mentioned in this article and no business relationship with any company mentioned. The author has not received compensation for writing this article, other than from FXStreet.

FXStreet and the author do not provide personalized recommendations. The author makes no representations as to the accuracy, completeness, or suitability of this information. FXStreet and the author will not be liable for any errors, omissions or any losses, injuries or damages arising from this information and its display or use. Errors and omissions excepted.

The author and FXStreet are not registered investment advisors and nothing in this article is intended to be investment advice.

Recommended content


Recommended content

Editors’ Picks

AUD/USD keeps the red below 0.6400 as Middle East war fears mount

AUD/USD keeps the red below 0.6400 as Middle East war fears mount

AUD/USD is keeping heavy losses below 0.6400, as risk-aversion persists following the news that Israel retaliated with missile strikes on a site in Iran. Fears of the Israel-Iran strife translating into a wider regional conflict are weighing on the higher-yielding Aussie Dollar. 

AUD/USD News

USD/JPY recovers above 154.00 despite Israel-Iran escalation

USD/JPY recovers above 154.00 despite Israel-Iran escalation

USD/JPY is recovering ground above 154.00 after falling hard on confirmation of reports of an Israeli missile strike on Iran, implying that an open conflict is underway and could only spread into a wider Middle East war. Safe-haven Japanese Yen jumped, helped by BoJ Governor Ueda's comments. 

USD/JPY News

Gold price pares gains below $2,400, geopolitical risks lend support

Gold price pares gains below $2,400, geopolitical risks lend support

Gold price is paring gains to trade back below  $2,400 early Friday, Iran's downplaying of Israel's attack has paused the Gold price rally but the upside remains supported amid mounting fears over a potential wider Middle East regional conflict. 

Gold News

WTI surges to $85.00 amid Israel-Iran tensions

WTI surges to $85.00 amid Israel-Iran tensions

Western Texas Intermediate, the US crude oil benchmark, is trading around $85.00 on Friday. The black gold gains traction on the day amid the escalating tension between Israel and Iran after a US official confirmed that Israeli missiles had hit a site in Iran.

Oil News

Dogwifhat price pumps 5% ahead of possible Coinbase effect

Dogwifhat price pumps 5% ahead of possible Coinbase effect

Dogwifhat price recorded an uptick on Thursday, going as far as to outperform its peers in the meme coins space. Second only to Bonk Inu, WIF token’s show of strength was not just influenced by Bitcoin price reclaiming above $63,000.

Read more

Forex MAJORS

Cryptocurrencies

Signatures