|

NZD/USD Price Analysis: Focus on multi-day-old support near 0.5980 as key US data, events loom

  • NZD/USD fades bounce off three-month-old descending support line, stays pressured at the lowest levels since November 2022.
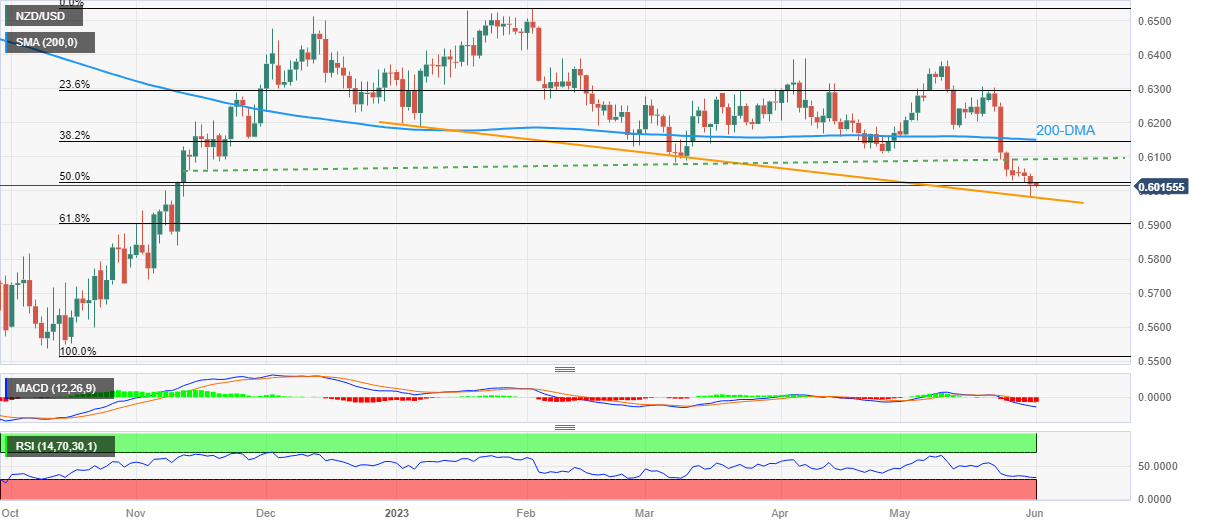
  • Oversold RSI backs corrective bounce off the key support but bearish MACD signals turn down recovery hopes.
  • Convergence of 200-DMA, 38.2% Fibonacci retracement restricts short-term upside.
  • US ADP Employment Change, multiple PMIs eyed for clear directions.

NZD/USD fades bounce off a three-month-old key support line while dropping back to 0.6015 during early Thursday in Asia.

In doing so, the Kiwi pair justifies the bearish MACD signals to extend the previous week’s downside break of the 200-DMA while keeping the bears in the driver’s seat at the lowest levels in seven months. It’s worth noting, however, that the RSI (14) line is almost oversold and hence can offer intermediate bounces during the south-run.

With this, the NZD/USD price may again test the aforementioned support line stretched from March, close to 0.5980 by the press time. However, the quote’s further downside appears elusive.

In a case where the Kiwi pair breaks the stated support line, it can quickly drop to the 61.8% Fibonacci retracement level of October 2022 to February 2023 upside, near 0.5900.

On the other hand, recovery remains unimpressive below an upward-sloping previous support line from mid-November 2022, surrounding 0.6100.

Even so, the NZD/USD pair buyers remain off the table unless witnessing a daily closing beyond a convergence of the 200-DMA and 38.2% Fibonacci retracement, near 0.6150.

NZD/USD: Daily chart

Trend: Limited downside expected

Additional important levels

Overview
Today last price0.6019
Today Daily Change-0.0025
Today Daily Change %-0.41%
Today daily open0.6044
 
Trends
Daily SMA200.6213
Daily SMA500.6214
Daily SMA1000.626
Daily SMA2000.6152
 
Levels
Previous Daily High0.6067
Previous Daily Low0.6025
Previous Weekly High0.6303
Previous Weekly Low0.6032
Previous Monthly High0.6389
Previous Monthly Low0.6111
Daily Fibonacci 38.2%0.6041
Daily Fibonacci 61.8%0.6051
Daily Pivot Point S10.6024
Daily Pivot Point S20.6003
Daily Pivot Point S30.5982
Daily Pivot Point R10.6066
Daily Pivot Point R20.6087
Daily Pivot Point R30.6108

Author

Anil Panchal

Anil Panchal

FXStreet

Anil Panchal has nearly 15 years of experience in tracking financial markets. With a keen interest in macroeconomics, Anil aptly tracks global news/updates and stays well-informed about the global financial moves and their implications.

More from Anil Panchal
Share:

Editor's Picks

EUR/USD retreats below 1.1800 following earlier rebound

EUR/USD loses its recovery momentum and trades little-changed on the day below 1.1300 in the second half of the day on Wednesday. The modest improvement seen in risk mood limits the US Dollar's gains and allows the pair to hold its ground.

GBP/USD clings to small gains above 1.3500

GBP/USD is posting moderate gains above 1.3500 on Wednesday. The pair edges higher as the US Dollar meets fresh supply amid a modest improvement seen in risk sentiment following US President Donald Trump’s first State of the Union address.

Gold rises toward $5,200, supported by geopolitics and trade jitters

Gold buyers are back in the game, eyeing $5,200 and beyonf on Wednesday after seeing a correction from monthly highs on Tuesday. The US Dollar slips after Trump’s SOTU fails to impress and as AI-driven worries ease. Dovish Fed bets also weigh.  Gold looks north so long as the key 61.8% Fibo resistance at $5,142 holds on the daily chart.

Bitcoin, Ethereum and Ripple post cautious recovery amid downside risks

Bitcoin, Ethereum, and Ripple are posting a cautious recovery on Wednesday following a market correction earlier this week.  BTC is approaching a key breakdown level, while ETH and XRP are rebounding from crucial support levels.

Nvidia remains at the heart of the AI boom

Nvidia remains at the heart of the AI boom, with Q4 revenue projected near $65.6–66.1 billion, nearly 70% higher year-over-year. But investors are watching cash flow, leverage, and broader AI adoption. Growth is strong, but the AI stress isn’t over.

Cosmos Hub Price Forecast: ATOM rebounds slightly, bearish outlook remains intact

Cosmos Hub (ATOM) price rebounds, trading above $2.05 at the time of writing on Wednesday, after undergoing a sharp correction since last week. Weakening on-chain and derivatives data support a bearish outlook, while technical analysis remains unfavorable.