|

NZD/USD Price Analysis: Fades bounce off 200-HMA despite upbeat China trade data

  • NZD/USD takes offers to pare weekly gains strong China trade figures.
  • China Customs fail to cheer the strong trade volume in 2022 as figures jumped 40 trillion Yuan.
  • Weekly resistance line guards immediate upside, 100-HMA probes bears.
  • MACD, RSI also favor the pullback moves despite firmer China trade numbers  for 2022.

NZD/USD slides towards the intraday low of 0.6369 as it takes offers to 0.6372 despite firmer China trade numbers for December, published early Friday.

That said, China’s Trade Balance figures jumped to a record high in Yuan terms for 2022. However, China Customs Spokesperson Lyu Daliang mentioned that China's foreign trade will continue to face a number of challenges and difficulties in 2023, per Reuters.

It should be noted that China's Trade Balance grew 7.7% in 2022. “China's total goods imports and exports hit a record high again in 2022, expanding 7.7% year on year to 42.07 trillion yuan (about 6.25 trillion U.S. dollars), official data showed Friday,” per Xinhua.

Technically, NZD/USD extends the early-day pullback from the weekly resistance line, around 0.6420 at the latest to poke 100-HMA support of 0.6370.

In doing so, the Kiwi pair fades the previous day’s bounce off the 200-HMA, at 0.6325 by the press time.

Given the looming bear cross on the MACD and RSI (14) retreat, as well as the China Customs’ pessimism surrounding trade conditions in 2023, the NZD/USD pair is likely to witness further downside. Though, the sellers might have a tough time in breaking the 200-HMA support.

NZD/USD: Hourly chart

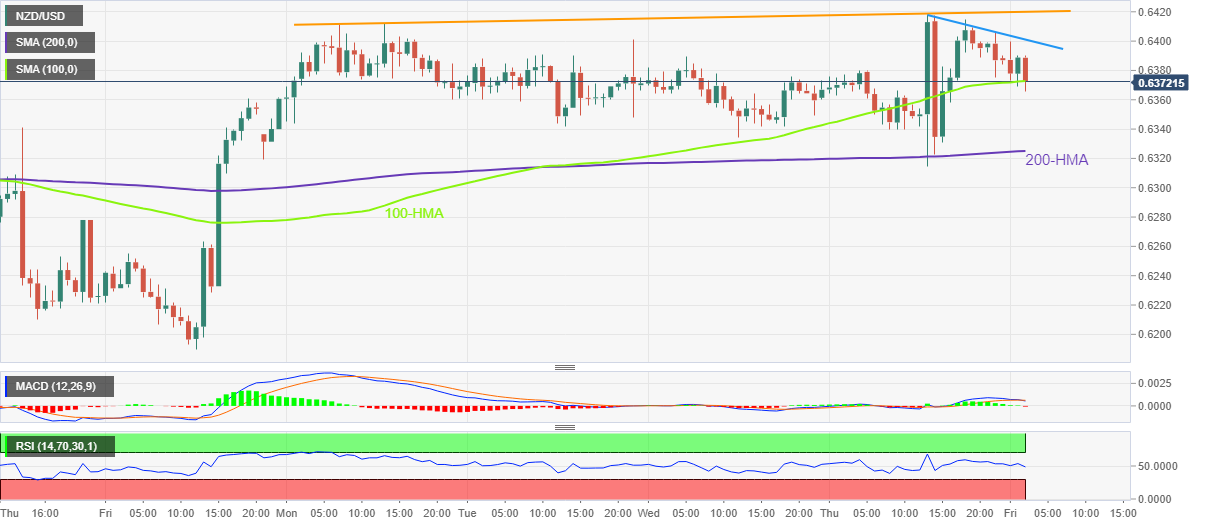
Trend: Further downside expected

Additional important levels

Overview
Today last price0.6373
Today Daily Change-0.0022
Today Daily Change %-0.34%
Today daily open0.6395
 
Trends
Daily SMA200.6323
Daily SMA500.6258
Daily SMA1000.6047
Daily SMA2000.6213
 
Levels
Previous Daily High0.6418
Previous Daily Low0.6314
Previous Weekly High0.6363
Previous Weekly Low0.619
Previous Monthly High0.6514
Previous Monthly Low0.623
Daily Fibonacci 38.2%0.6379
Daily Fibonacci 61.8%0.6354
Daily Pivot Point S10.6334
Daily Pivot Point S20.6272
Daily Pivot Point S30.623
Daily Pivot Point R10.6438
Daily Pivot Point R20.648
Daily Pivot Point R30.6542

Author

Anil Panchal

Anil Panchal

FXStreet

Anil Panchal has nearly 15 years of experience in tracking financial markets. With a keen interest in macroeconomics, Anil aptly tracks global news/updates and stays well-informed about the global financial moves and their implications.

More from Anil Panchal
Share:

Markets move fast. We move first.

Orange Juice Newsletter brings you expert driven insights - not headlines. Every day on your inbox.

By subscribing you agree to our Terms and conditions.

Editor's Picks

EUR/USD falls to near 1.1700 due to safe-haven demand

EUR/USD extends its losses, trading around 1.1710 during the Asian hours on Monday. The pair loses ground as the US Dollar strengthens on safe-haven demand, driven by a renewed rise in geopolitical risks following the United States’ capture of Venezuelan President Nicolas Maduro.

GBP/USD trades with modest losses below mid-1.3400s as geopolitical tensions lift USD

The GBP/USD pair opens with a modest bearish gap at the start of a new week and trades just below mid-1.3400s during the Asian session, down 0.10% for the day. Spot prices, however, lack follow-through selling and manage to hold above last week's swing low amid mixed fundamental cues.

Gold jumps over 1.5% to near $4,400 on US-Venezuela tensions

Gold holds sizeable gains near $4,400 in the Asian trading hours on Monday. The traditional safe-haven metal capitalizes on escalating geopolitical risks after the United States' capture of Venezuelan President Nicolas Maduro. Traders will closely monitor developments surrounding the US seizure of Maduro and await the US ISM Manufacturing Purchasing Managers' Index data later on Monday. 

Powerful guide to ISM, building permits, NFP and Silver technicals

Next week is important for U.S. markets. We get key economic data that can move stocks, bonds, and the dollar. The main reports are ISM Manufacturing, ISM Services, Building Permits, and Non-Farm Payrolls. Traders will watch these closely.

Economic outlook 2026-2027 in advanced countries: Solidity test

After a year marked by global economic resilience and ending on a note of optimism, 2026 looks promising and could be a year of solid economic performance. In our baseline scenario, we expect most of the supportive factors at work in 2025 to continue to play a role in 2026.

Crypto market outlook for 2026

Year 2025 was volatile, as crypto often is.  Among positive catalysts were favourable regulatory changes in the U.S., rise of Digital Asset Treasuries (DAT), adoption of AI and tokenization of Real-World-Assets (RWA).