|

NZD/USD Price Analysis: Extends recovery moves from monthly support line

  • NZD/USD defies the previous day’s declines while printing 0.10% gains.
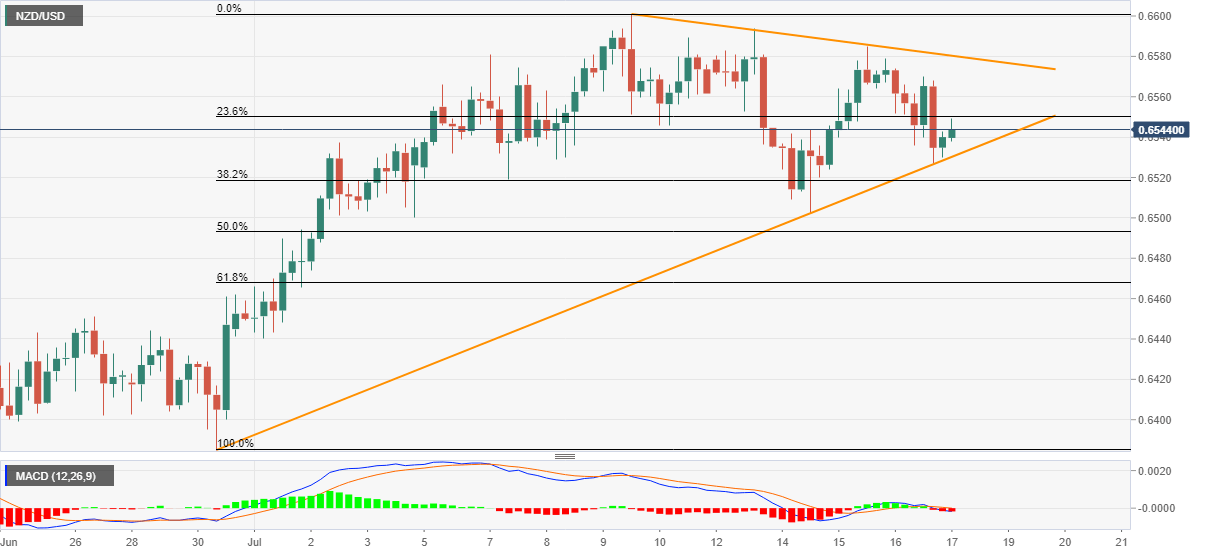
  • An upward sloping trend line from June 30 holds the gate for the fall towards the key Fibonacci retracement levels.
  • A one-week-old resistance line guards the near-term upside.

NZD/USD seesaws around 0.6540 during the early Friday’s trading. In doing so, the kiwi pair keeps its pullback moves from the short-term support line. It’s worth mentioning that the quote dropped heavily the previous day.

Hence, buyers might aim to refresh the monthly top near 0.6600. However, bearish MACD and nearby falling trend line, currently around 0.6580, questions the bulls.

If at all the NZD/USD prices cross all odds to and remain firm past-0.6600, the mid-January month high near 0.6665 could gain the market’s attention.

Alternatively, the pair’s declines below the adjacent support line, at 0.6530, can attack 50% Fibonacci retracement of June 30 to July 09 upside, at 0.6493.

Should bears refrain from stepping back, 61.8% Fibonacci retracement level of 0.6467 and June 26 high of 0.6451 will flash on their radars.

NZD/USD four-hour chart

Trend: Further recovery expected

Additional important levels

Overview
Today last price0.6543
Today Daily Change7 pips
Today Daily Change %0.11%
Today daily open0.6536
 
Trends
Daily SMA200.6501
Daily SMA500.6359
Daily SMA1000.6198
Daily SMA2000.6341
 
Levels
Previous Daily High0.6579
Previous Daily Low0.6527
Previous Weekly High0.6601
Previous Weekly Low0.6519
Previous Monthly High0.6585
Previous Monthly Low0.6186
Daily Fibonacci 38.2%0.6547
Daily Fibonacci 61.8%0.6559
Daily Pivot Point S10.6515
Daily Pivot Point S20.6495
Daily Pivot Point S30.6463
Daily Pivot Point R10.6567
Daily Pivot Point R20.6599
Daily Pivot Point R30.6619

Author

Anil Panchal

Anil Panchal

FXStreet

Anil Panchal has nearly 15 years of experience in tracking financial markets. With a keen interest in macroeconomics, Anil aptly tracks global news/updates and stays well-informed about the global financial moves and their implications.

More from Anil Panchal
Share:

Editor's Picks

EUR/USD: Bears retain control below 1.1780-1.1770 confluence breakpoint

The EUR/USD pair remains on the back foot through the Asian session on Friday and currently trades just above mid-1.1700s, well within striking distance of a nearly one-month low set the previous day.

GBP/USD seems vulnerable near one-month low as traders await US data

The GBP/USD pair prolongs its weekly downtrend for the fifth consecutive day on Friday and slides back closer to a nearly one-month low, touched the previous day. Spot prices trade below mid-1.3400s during the Asian session on Friday and seem vulnerable to slide further as traders now look to important US macro data for a fresh impetus.

Gold eyes next breakout on US GDP, PCE inflation data

Gold sticks to recent gains around the $5,000-mark early Friday, biding time before the high-impact US macro events. The focus is now on the US fourth-quarter Gross Domestic Product, core Personal Consumption Expenditures Price Index and the Supreme Court’s ruling on President Donald Trump’s tariffs.

Bitcoin, Ethereum and Ripple remain range-bound as breakdown risks rise

Bitcoin, Ethereum, and Ripple are trading sideways within consolidation ranges on Friday, signaling a lack of directional bias in the broader crypto market. BTC rebounded from key support, and ETH is nearing the lower consolidation boundary, while XRP is holding at its lower trendline boundary. 

Hawkish Fed minutes and a market finding its footing

It was green across the board for US Stock market indexes at the close on Wednesday, with most S&P 500 names ending higher, adding 38 points (0.6%) to 6,881 overall. At the GICS sector level, energy led gains, followed by technology and consumer discretionary, while utilities and real estate posted the largest losses.

Official Trump price approaches breakout with mixed signals from traders

Official Trump (TRUMP) is trading at $3.50 at the time of writing, approaching its upper consolidation range. A breakout from this range could open the door for an upside move. On-chain data shows market indecision, with balanced flows between bulls and bears, signaling a lack of clear directional bias.