|

NZD/USD Price Analysis: Expects more gains above 0.6250 as risk-on impulse strengthens

  • NZD/USD has displayed a sheer recovery to near 0.6250 as the risk-on mood solidifies.
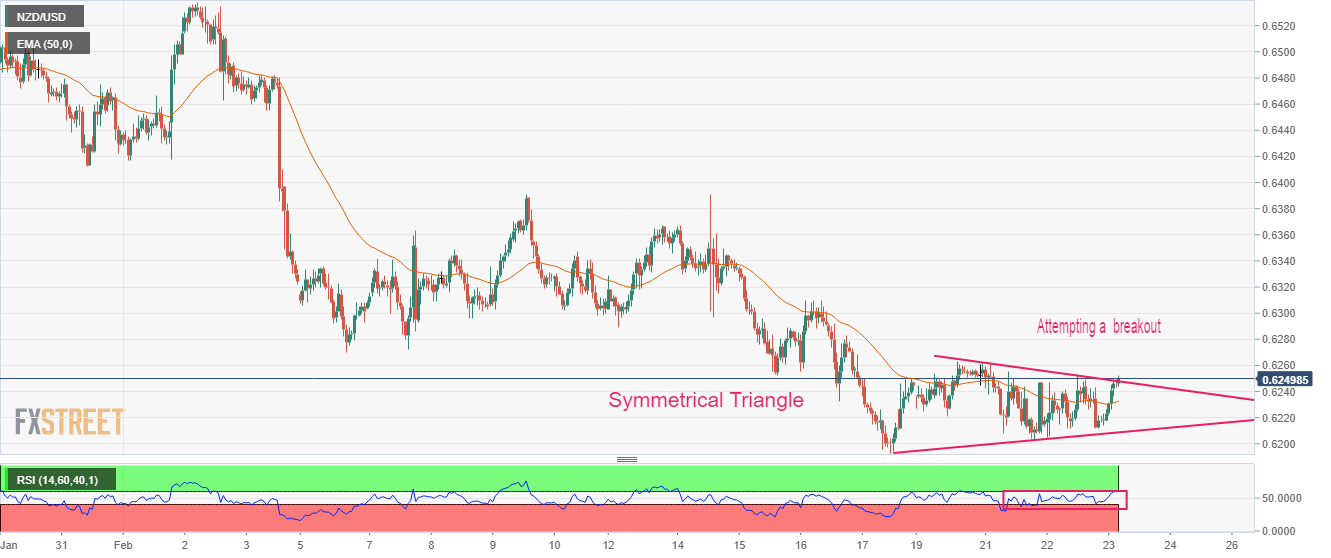
  • The Kiwi asset is attempting to deliver a breakout of the Symmetrical Triangle.
  • The RSI (14) is on the verge of delivering a break into the bullish range of 60.00-80.00.

The NZD/USD pair has recovered dramatically after sensing a buying interest around 0.6210 in the Asian session. The Kiwi asset has extended its recovery to near 0.6250 after a responsive buying action and is looking to drive its range extension further as the risk-on impulse has solidified.

Investors have digested the fact that galloping inflation in the United States needs immediate treatment, therefore, the Federal Reserve (Fed) cannot pause the policy tightening spell as it could dampen the efforts yet made to bring it down. The US Dollar Index (DXY) is resisting in continuing the downside further after correcting to near 104.00. However, the positive market sentiment could continue sending pressure on the safe-haven assets.

NZD/USD is attempting to deliver a breakout of the Symmetrical Triangle chart pattern that indicates a sheer volatility contraction on an hourly scale. The downward-sloping trendline of the above-mentioned chart pattern is placed from February 20 high at 0.6262 while the upward-sloping trendline is placed from February 17 low at 0.6204.

The Kiwi asset has successfully shifted its auction above the 50-period Exponential Moving Average (EMA) at 0.6233, which indicates more upside ahead.

Meanwhile, the Relative Strength Index (RSI) (14) is on the verge of delivering a break into the bullish range of 60.00-80.00, which will trigger the upside momentum.

For further upside, the Kiwi asset needs to surpass January 8 low at 0.6272, which will drive the asset towards January 9 low at 0.6320, followed by February 7 high at 0.6363.

Alternatively, a breakdown of January 6 low at 0.6193 will drag the asset toward November 28 low at 0.6155. A slippage below the latter will expose the asset for more downside toward the round-level support at 0.6100.

NZD/USD two-hour chart

NZD/USD

Overview
Today last price0.625
Today Daily Change0.0032
Today Daily Change %0.51
Today daily open0.6218
 
Trends
Daily SMA200.6347
Daily SMA500.6354
Daily SMA1000.6175
Daily SMA2000.6185
 
Levels
Previous Daily High0.6253
Previous Daily Low0.6205
Previous Weekly High0.6391
Previous Weekly Low0.6193
Previous Monthly High0.6531
Previous Monthly Low0.619
Daily Fibonacci 38.2%0.6235
Daily Fibonacci 61.8%0.6223
Daily Pivot Point S10.6198
Daily Pivot Point S20.6177
Daily Pivot Point S30.615
Daily Pivot Point R10.6246
Daily Pivot Point R20.6273
Daily Pivot Point R30.6294

Author

Sagar Dua

Sagar Dua

FXStreet

Sagar Dua is associated with the financial markets from his college days. Along with pursuing post-graduation in Commerce in 2014, he started his markets training with chart analysis.

More from Sagar Dua
Share:

Markets move fast. We move first.

Orange Juice Newsletter brings you expert driven insights - not headlines. Every day on your inbox.

By subscribing you agree to our Terms and conditions.

Editor's Picks

EUR/USD bears await break below 100-day SMA support near 1.1665 area

The EUR/USD pair attracts heavy selling for the second straight day and dives to a nearly four-week trough, around the 1.1670 region, during the Asian session on Monday. Bearish traders now await a sustained break below the 100-day Simple Moving Average before positioning for an extension of the recent pullback from a three-month top, or levels just above the 1.1800 mark touched on December 24.

GBP/USD falls toward 1.3400 near 50-day EMA

GBP/USD extends its losses for the second successive session, trading around 1.3420 during the Asian hours on Monday. The technical analysis of the daily chart indicates that the 14-day Relative Strength Index at 53 has eased from near overbought, indicating that momentum has cooled while remaining above the midline. RSI holds above 50, keeping a modest bullish bias.

Gold on fire at the start of the week on US-Venezuela tensions

Gold regains upside traction early Monday as flight to safety prevails on Venezuela turmoil. The US Dollar finds strong haven demand, caps Gold’s upside as focus shifts to US jobs data. Gold’s daily technical setup suggests that more upside remains in the offing.

Bulls firmly in control as Bitcoin breaks $93K, Ethereum and Ripple extend gains

Bitcoin, Ethereum, and Ripple extended their rallies on Monday, gaining more than 4%, 6%, and 12%, respectively, in the previous week. The top three cryptocurrencies by market capitalization could continue to outperform, with bulls in control of the momentum.

Economic outlook 2026-2027 in advanced countries: Solidity test

After a year marked by global economic resilience and ending on a note of optimism, 2026 looks promising and could be a year of solid economic performance. In our baseline scenario, we expect most of the supportive factors at work in 2025 to continue to play a role in 2026.

Meme Coins Price Prediction: Dogecoin, Shiba Inu, Pepe rally on Venezuela’s shadow BTC reserve

Meme coins such as Dogecoin, Shiba Inu, and Pepe are leading the cryptocurrency market rally driven by the US cross-border operation to capture Venezuelan President Nicolás Maduro. Dogecoin extends its gain for the fifth consecutive day while SHIB and PEPE take a pause.