NZD/USD Price Analysis: Drops further towards yearly low near 0.6800
- NZD/USD prints six-day south-run to refresh the three-month low.
- Clear break of 14-month-old support line directs bears to yearly low, September 2020 high.
- Three-week-long resistance line resistance line adds to the upside filters.

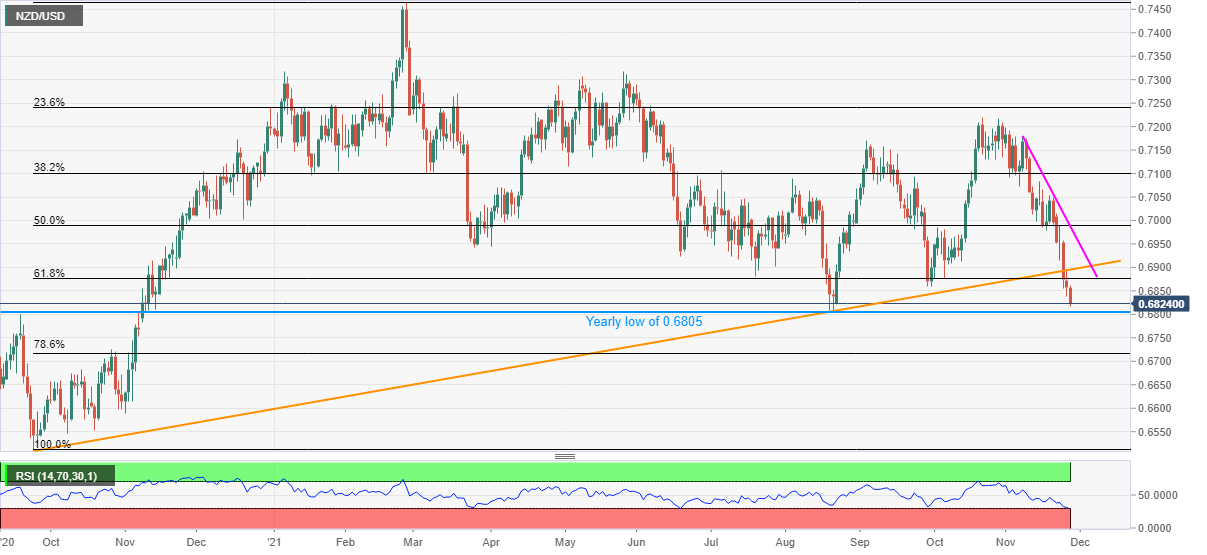
NZD/USD remains pressured around 0.6825 after dropping to the lowest since late August during early Friday. That said, the Kiwi pair registers 0.50% intraday loss while printing the six-day downtrend.
Having conquered a 14-month-old support line, NZD/USD bears smashed 61.8% Fibonacci retracement (Fibo.) of September 2020 to February 2021 upside, which in turn suggests the quote’s further weakness towards the yearly bottom of 0.6805.
Though, oversold RSI conditions may trigger a corrective pullback from the 0.6805 threshold, if not then the September 2020 peak of 0.6800 will act as an extra filter before directing the quote towards 78.6% Fibo. near 0.6715.
Alternatively, 61.8% Fibonacci retracement level of 0.6875 and the previous support line near 0.6900 guards short-term NZD/USD upside.
Following that, a confluence of the 50% Fibo. and short-term descending trend line, as well as the mid-November’s swing high, respectively around 0.6990 and 0.7085, will lure the pair buyers.
Overall, NZD/USD bears keep reins but the 0.6805-6800 region appears a tough nut to crack for them.
NZD/USD: Daily chart
Trend: Further weakness expected
Author

Anil Panchal
FXStreet
Anil Panchal has nearly 15 years of experience in tracking financial markets. With a keen interest in macroeconomics, Anil aptly tracks global news/updates and stays well-informed about the global financial moves and their implications.


