|

NZD/USD Price Analysis: Dip challenges support at the 20-day SMA

  • NZD/USD eases on Thursday, hovering near 0.5610 in a cautious market mood.
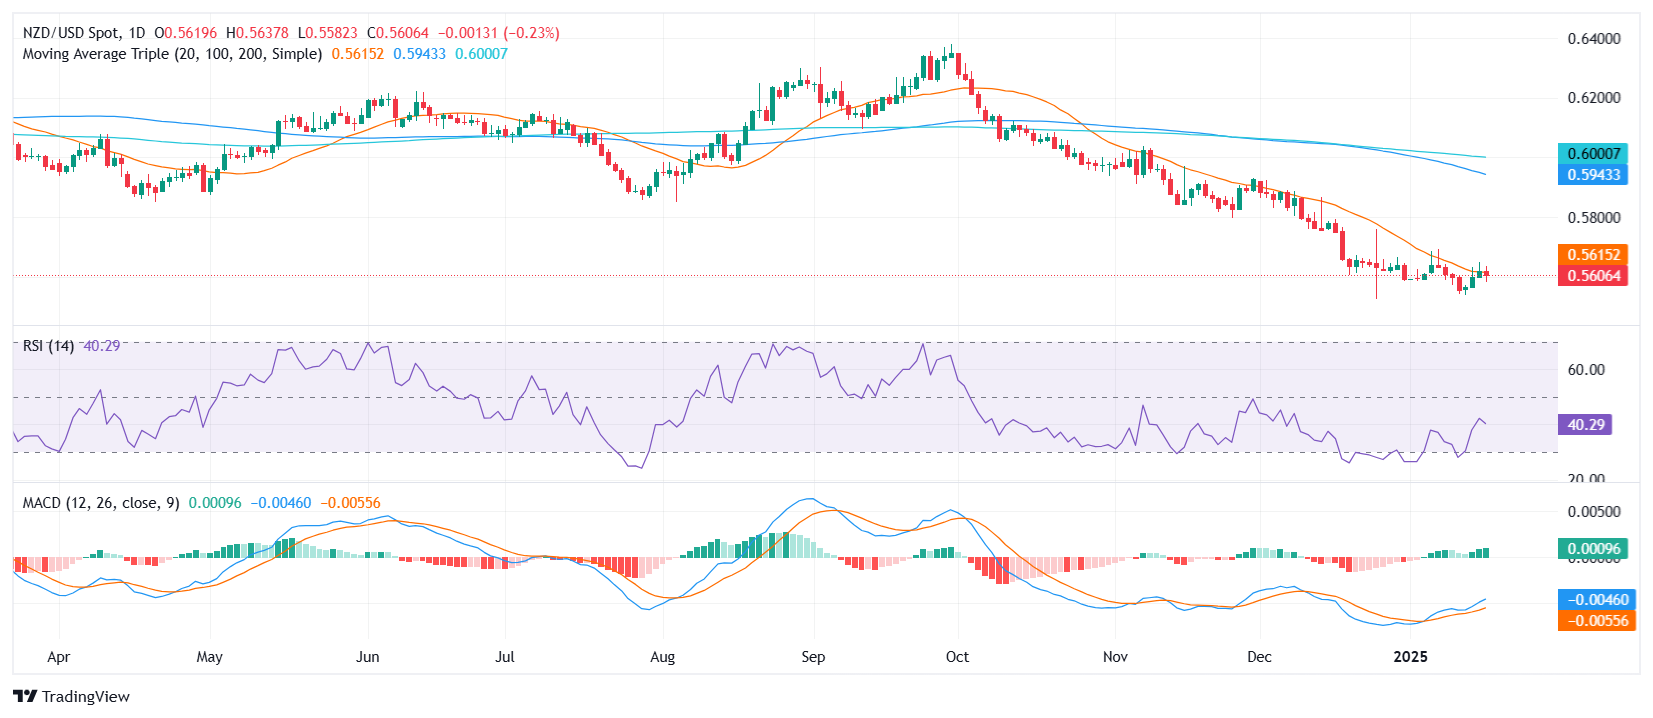
  • MACD histogram shows rising green bars, hinting at subdued but ongoing buyer interest.
  • RSI sits at 45, slipping slightly yet staying within a mild negative zone.

The NZD/USD pair encountered modest pressure on Thursday, drifting 0.16% lower to roughly 0.5610. Despite this pullback, the exchange rate has managed to hold close to its 20-day Simple Moving Average (SMA), a signal that buyers could be attempting to build a floor under recent price action. While momentum remains tepid, the pair’s resilience at this critical threshold indicates a measured appetite for higher levels.

Technically, the Moving Average Convergence Divergence (MACD) histogram continues to print rising green bars, suggesting that, although not overwhelming, there is a degree of underlying demand. Meanwhile, the Relative Strength Index (RSI) has edged down to 45, reflecting a slight decline in bullish conviction without totally ceding ground to sellers. This delicate balance between optimism and caution leaves NZD/USD in a precarious spot.

Going forward, a sustained hold above the 20-day SMA near 0.5600 would underline the possibility of further gains, potentially guiding the pair toward the 0.5650 region. Conversely, a break beneath the immediate support could target 0.5580, with a deeper slide exposing 0.5550 if sentiment takes another negative turn.

NZD/USD daily chart

Author

Patricio Martín

Patricio is an economist from Argentina passionate about global finance and understanding the daily movements of the markets.

More from Patricio Martín
Share:

Editor's Picks

EUR/USD stays near 1.1650 with fading momentum

EUR/USD holds ground after five days of losses, trading around 1.1650 during the Asian hours on Friday. The 14-day Relative Strength Index momentum indicator at 39 trends lower, confirming fading momentum rather than oversold conditions.

GBP/USD remains below 1.3450, nine-day EMA

GBP/USD remains subdued for the fourth consecutive day, trading around 1.3430 during the Asian hours on Friday. The momentum indicator 14-day Relative Strength Index at 51.9 is neutral, reflecting slower momentum after firm recent readings. An RSI drop back beneath 50 would strengthen the case for a deeper pullback.

Gold edges lower as USD preserves its recent gains ahead of US NFP report

Gold struggles to capitalize on the previous day's goodish rebound from the vicinity of the $4,400 mark and attracts fresh sellers during the Asian session on Friday. The US Dollar preserves its gains registered over the past two weeks and touches a nearly one-month high, undermining the commodity. 

Bitcoin, Ethereum and Ripple find key support, reviving rally hopes

Bitcoin, Ethereum, and Ripple steadied above key support levels on Friday after being rejected at mid-week resistance zones. The short-term recovery prospects remain intact if the top three cryptocurrencies by market capitalization hold these support zones.

2026 economic outlook: Clear skies but don’t unfasten your seatbelts yet

Most years fade into the background as soon as a new one starts. Not 2025: a year of epochal shifts, in which the macroeconomy was the dog that did not bark. What to expect in 2026? The shocks of 2025 will not be undone, but neither will they be repeated.

Pepe Price Forecast: PEPE risks 100-day EMA fallout as bullish interest fades

Pepe is under extreme selling pressure, trading in the red for the fifth consecutive day, down 1% at press time on Friday. Pepe’s decline following a 72% hike last week suggests a likely profit-booking phase, while on-chain data indicates declining network activity.