|

NZD/USD Price Analysis: Corrective pullback needs validation from 0.6300 to sustain

  • NZD/USD pauses seven-day downtrend near the monthly low.
  • Nearly oversold RSI seems to underpin recovery moves but previous support from early May challenges rebound.
  • 20-DMA, descending resistance line from April adds to the upside filters.
  • Bearish MACD, key support break favor sellers eyeing 61.8% FE.

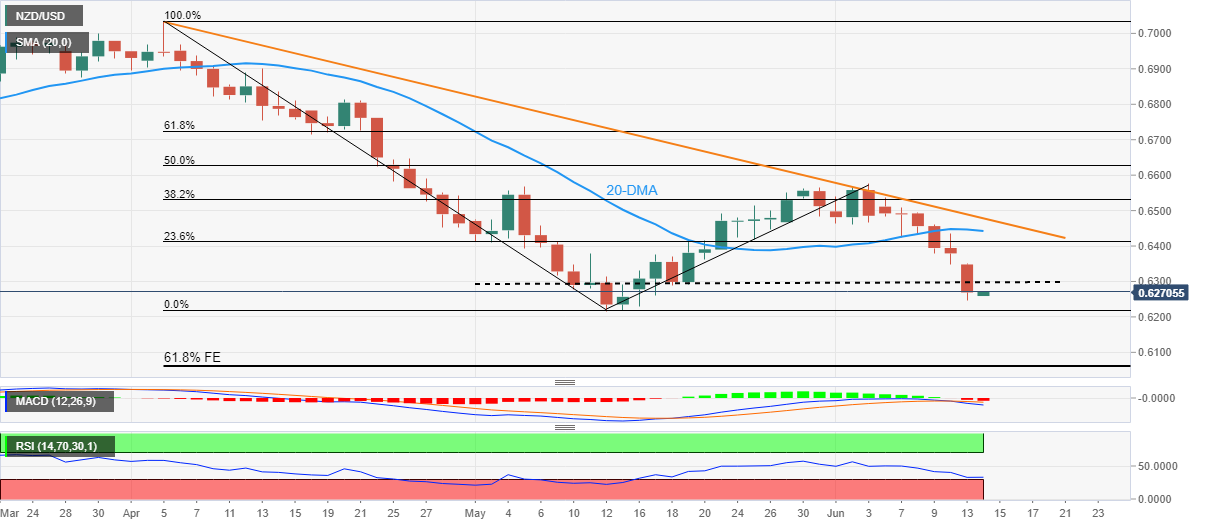
NZD/USD portrays a corrective pullback around a one-month low, snapping a seven-day downtrend, during Tuesday’s inactive Asian session. The kiwi pair refreshed the monthly low to 0.6246 before recently bouncing off to 0.6270.

The recovery moves seem to take clues from the nearly oversold RSI (14) line. However, the pair remains below the previous horizontal support line from May 10, broken the previous day, which in turn joins the bearish MACD signal to keep sellers hopeful.

Even if the quote rises past the 0.6300 immediate hurdle, the 20-DMA near 0.6442 and a 2.5-month-old downward sloping resistance line, near 0.6480, will be crucial for NZD/USD buyer’s return.

Also acting as an upside filter is the monthly high near 0.6580.

Alternatively, fresh declines could be aimed for the yearly low surrounding 0.6215 and may again portray indecision near the 0.6200 threshold.

It’s worth noting that multiple lows marked during March and April of 2020 could also challenge NZD/USD near around 0.6150 before directing them to the 61.8% Fibonacci Expansion (FE) of April-May moves, near 0.6070-65.

NZD/USD: Daily chart

Trend: Further weakness expected

Additional important levels

Overview
Today last price0.627
Today Daily Change-0.0109
Today Daily Change %-1.71%
Today daily open0.6379
 
Trends
Daily SMA200.6438
Daily SMA500.6561
Daily SMA1000.6661
Daily SMA2000.6804
 
Levels
Previous Daily High0.6436
Previous Daily Low0.6348
Previous Weekly High0.6538
Previous Weekly Low0.6348
Previous Monthly High0.6569
Previous Monthly Low0.6217
Daily Fibonacci 38.2%0.6382
Daily Fibonacci 61.8%0.6403
Daily Pivot Point S10.634
Daily Pivot Point S20.63
Daily Pivot Point S30.6252
Daily Pivot Point R10.6427
Daily Pivot Point R20.6476
Daily Pivot Point R30.6515

Author

Anil Panchal

Anil Panchal

FXStreet

Anil Panchal has nearly 15 years of experience in tracking financial markets. With a keen interest in macroeconomics, Anil aptly tracks global news/updates and stays well-informed about the global financial moves and their implications.

More from Anil Panchal
Share:

Editor's Picks

EUR/USD treads water around 1.1900

EUR/USD edges a tad lower around the 1.1900 area, coming under mild pressure despite the US Dollar keeps the offered stance on turnaround Tuesday. On the US data front, December Retail Sales fell short of expectations, while the ADP four week average printed at 6.5K.

GBP/USD looks weak near 1.3670

GBP/USD trades on the back foot around the 1.3670 region on Tuesday. Cable’s modest retracement also comes in tandem with the decent decline in the Greenback. Moving forward, the US NFP and CPI data in combination with key UK releases should kee the quid under scrutiny in the next few days.

Gold the battle of wills continues with bulls not ready to give up

Gold comes under marked selling pressure on Tuesday, giving back part of its recent two day advance and threatening to challenge the key $5,000 mark per troy ounce. The yellow metal’s correction follows a better tone in the risk complex, a lower Greenback and shrinking US Treasuty yields.

AI Crypto Update: BankrCoin, Pippin surge as sector market cap steadies above $12B

The Artificial Intelligence (AI) segment is largely on the back foot with major coins such as Bittensor (TAO) and Internet Computer (ICP) extending losses amid a sticky risk-off sentiment.

Dollar drops and stocks rally: The week of reckoning for US economic data

Following a sizeable move lower in US technology Stocks last week, we have witnessed a meaningful recovery unfold. The USD Index is in a concerning position; the monthly price continues to hold the south channel support.

XRP holds $1.40 amid ETF inflows and stable derivatives market

Ripple trades under pressure, with immediate support at $1.40 holding at the time of writing on Tuesday. A recovery attempt from last week’s sell-off to $1.12 stalled at $1.54 on Friday, leading to limited price action between the current support and the resistance.