NZD/USD Price Analysis: Bulls testing bearish commitments at 61.8% Fibo
- NZD/USD is testing the bear's commitments at the 61.8% Fibo.
- Bulls need to get over the line from an hourly perspective.

NZD/USD bears are lining up at the 61.8% Fibo and old structure.
The following illustrates a bearish bias from a daily perspective but does not rule out a break of current resistance either.
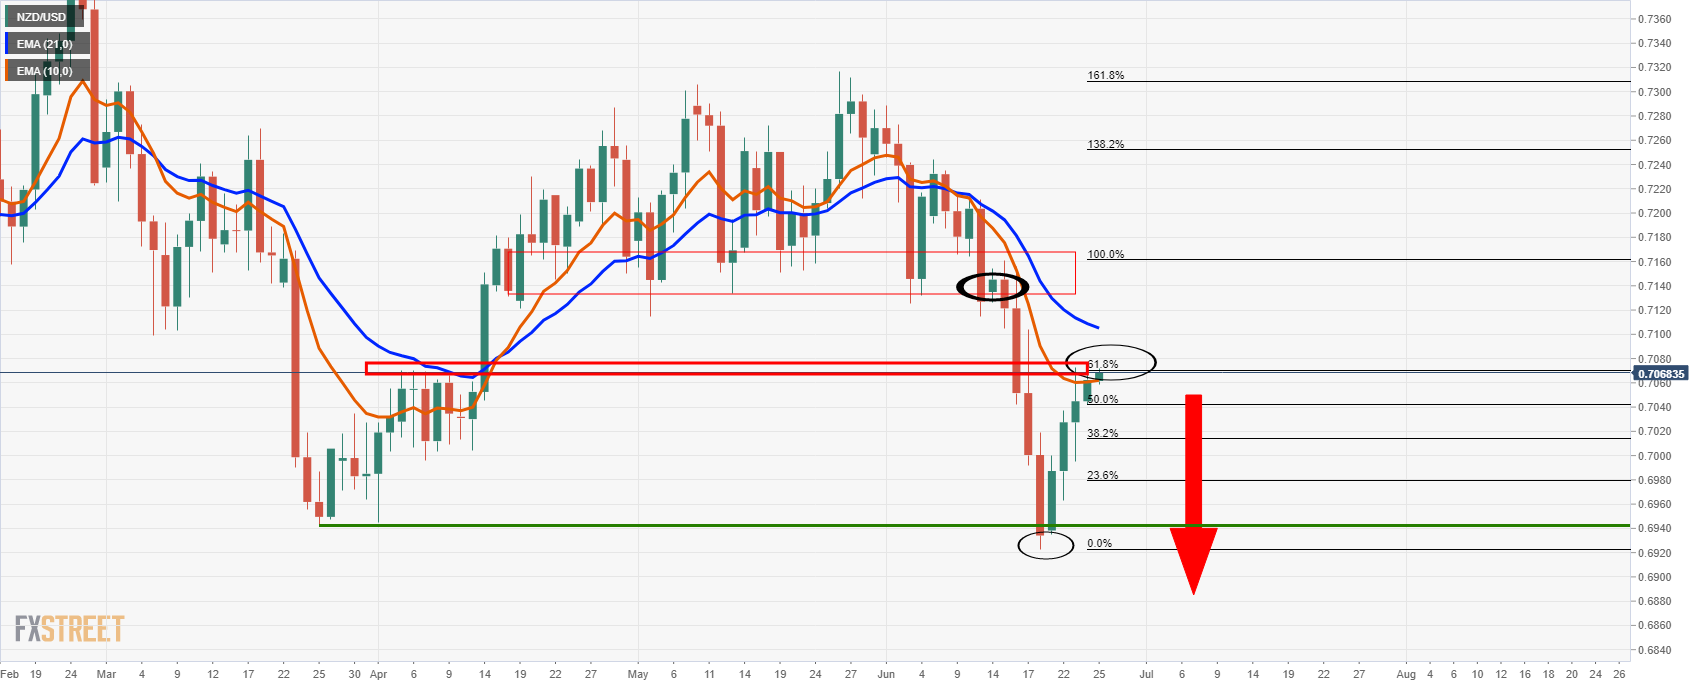
NZD/USD daily chart
The daily charts illustrate the bearish environment with the 10 EMA below the 21 EMA with the price at a 61.8% Fibonacci level that would be expected to act as resistance.
With that being said, there are prospects of a test of the 21-EMA and old structure in the 0.7130s.
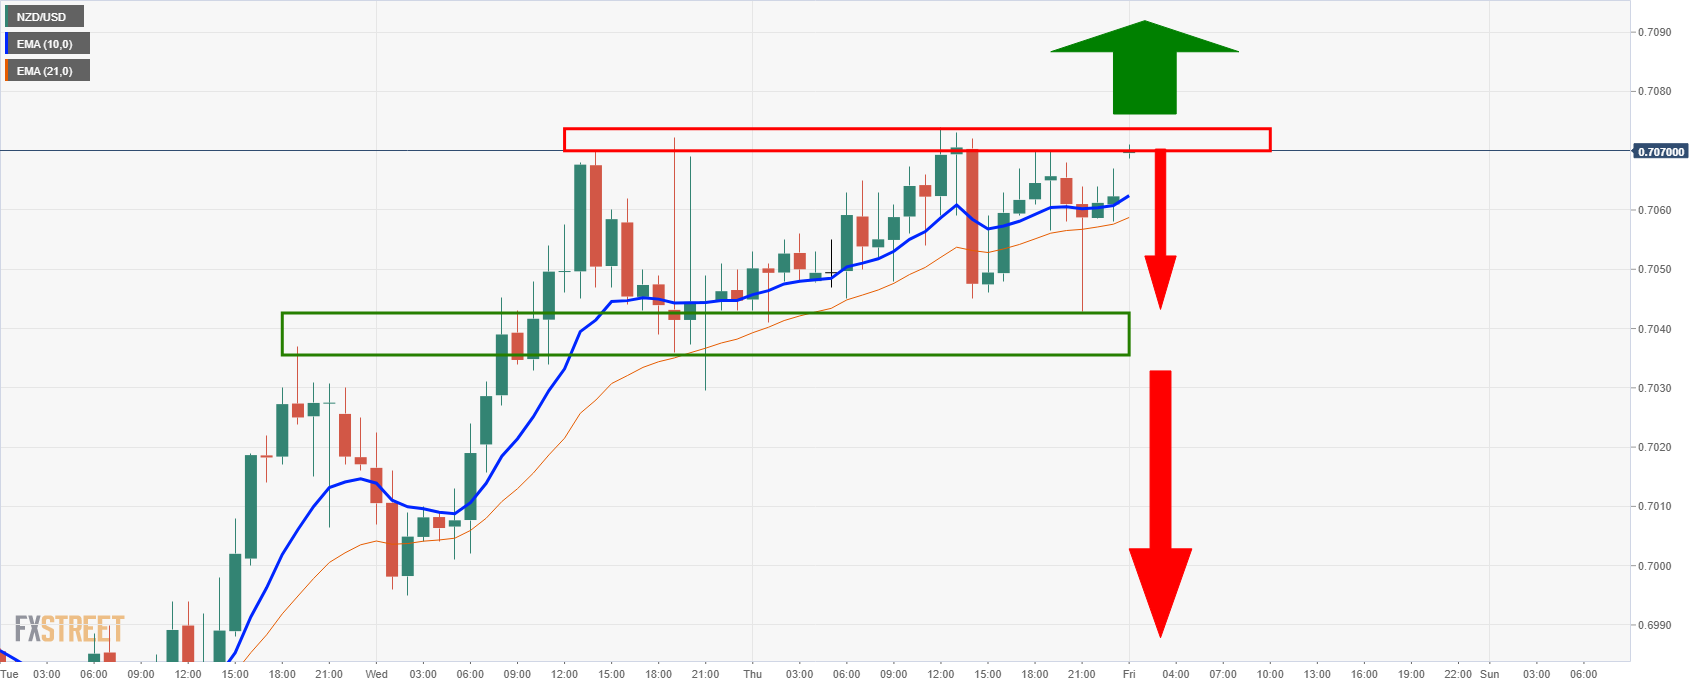
NZD/IUSD hourly chart
However, from an hourly perspective, the price is trapped between support and resistance.
In the current trade, the price is testing the resistance at 0.7070.
Author

Ross J Burland
FXStreet
Ross J Burland, born in England, UK, is a sportsman at heart. He played Rugby and Judo for his county, Kent and the South East of England Rugby team.


