|

NZD/USD Price Analysis: Bulls surge to back to highs since January, eyeing 100-day SMA retest

  • NZD/USD jumps to 0.5765 on Thursday, reaching its highest level since January.
  • The RSI climbs to 62, nearing overbought territory but still signaling room for further gains.
  • MACD histogram shows rising green bars, indicating sustained bullish momentum and potential for continued upside.

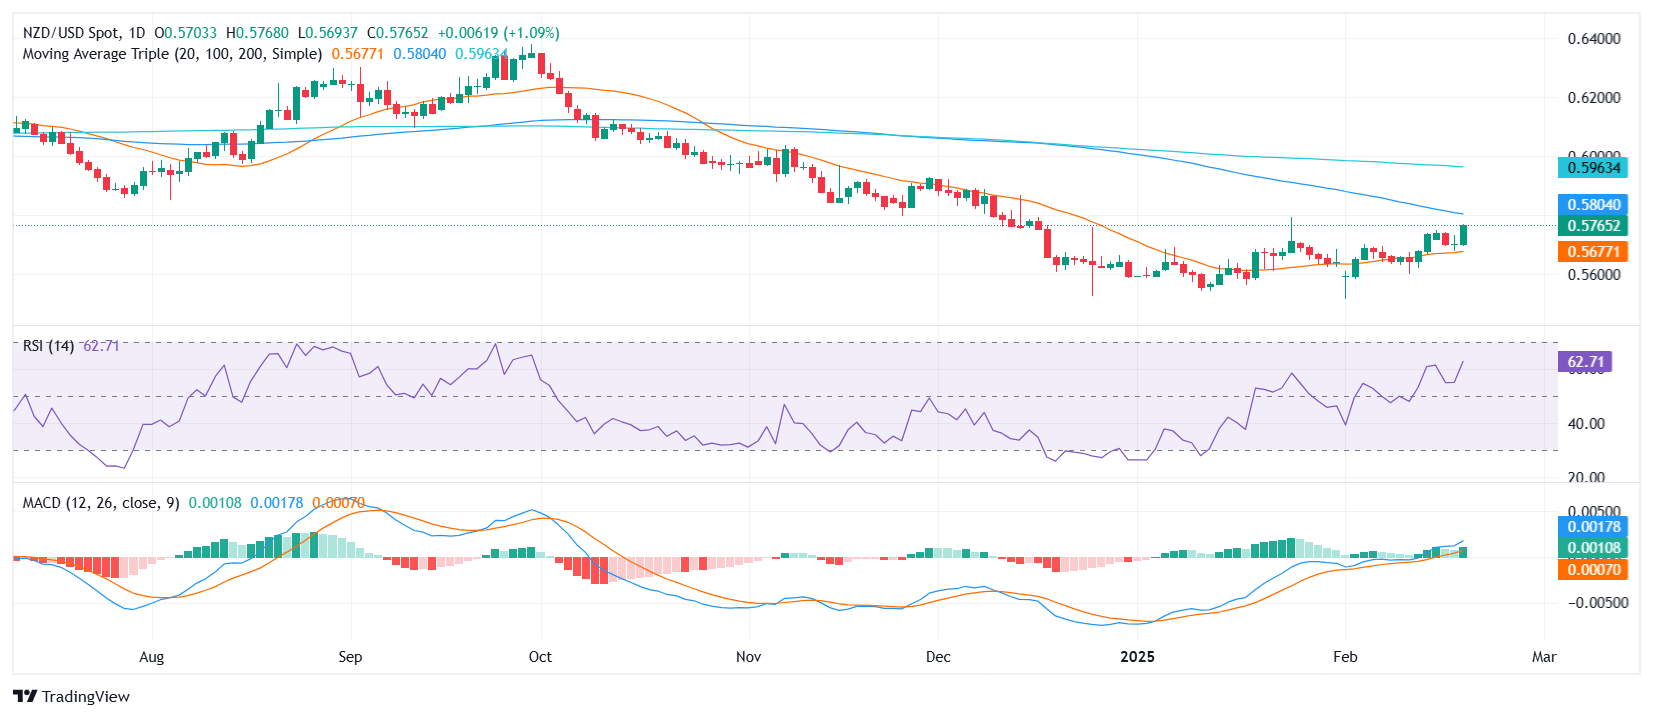
The NZD/USD pair staged an impressive rally on Thursday, climbing 1.03% to close at 0.5765, marking its highest point since January. Buyers regained control, building on recent momentum as the pair looks poised to retest the 100-day Simple Moving Average (SMA), which stands as the next major resistance level.

Technical indicators support the bullish outlook. The Relative Strength Index (RSI) surged to 65, edging closer to overbought territory but still offering room for additional upside before triggering exhaustion signals. Meanwhile, the Moving Average Convergence Divergence (MACD) histogram continues to print rising green bars, highlighting sustained buying pressure and strengthening momentum.

Looking forward, a successful break above the 100-day SMA, currently around 0.5805, could open the door for further gains, potentially extending the bullish trend. On the downside, immediate support is seen near 0.5700, with a drop below this level potentially triggering a deeper correction. However, with indicators still favoring buyers, the near-term bias remains tilted to the upside.

NZD/USD daily chart

Author

Patricio Martín

Patricio is an economist from Argentina passionate about global finance and understanding the daily movements of the markets.

More from Patricio Martín
Share:

Markets move fast. We move first.

Orange Juice Newsletter brings you expert driven insights - not headlines. Every day on your inbox.

By subscribing you agree to our Terms and conditions.

Editor's Picks

EUR/USD eases to near 1.1650, eyes US PCE for fresh impetus

EUR/USD turns south to test 1.1650 in European trading on Friday, facing rejection once again near seven-week highs. The pair, however, continues to draw support from persistent US Dollar selling bias, despite a cautious market mood. Traders now await the US September PCE inflation and UoM Consumer Sentiment data. 

GBP/USD holds gains near 1.3350 ahead of US data

GBP/USD sticks to a positive bias near 1.3350 in the European session on Friday. Traders prefer to wait on the sidelines ahead of the key US inflation and sentiment data due later in the day. In the meantime, broad-based US Dollar weakness helps the pair stay afloat. 

Gold remains below $4,250 barrier as traders await US PCE data for directional impetus

Gold gains some positive traction on Friday, though it remains confined in the weekly range. Dovish Fed expectations continue to undermine the USD and lend support to the commodity. Bulls, however, might opt to wait for the US PCE Price Index before placing aggressive bets.

Pi Network: Bearish streak nears critical support trendline

Pi Network edges lower on Friday for the third consecutive day, approaching a local support trendline. The on-chain data suggests an increase in supply pressure as Centralized Exchanges experience a surge in inflows. Technically, the pullback in PI risks further losses, as the Moving Average Convergence Divergence indicator is flashing a sell signal. 

Canada Unemployment Rate expected to edge higher in November ahead of BoC rate decision

Statistics Canada will release its Labour Force Survey on Friday, and markets are bracing for a weak print. The Unemployment Rate is expected to tick higher to 7% in November, while the Employment Change is forecast to come in flat after a nice gain in October.

Pi Network Price Forecast: Bearish streak nears critical support trendline

Pi Network (PI) edges lower on Friday for the third consecutive day, approaching a local support trendline. The on-chain data suggests an increase in supply pressure as Centralized Exchanges (CEXs) experience a surge in inflows.