|

NZD/USD Price Analysis: Bulls need clear break of 0.6480 to keep the driver’s seat

  • NZD/USD struggles for clear directions at six-month high.
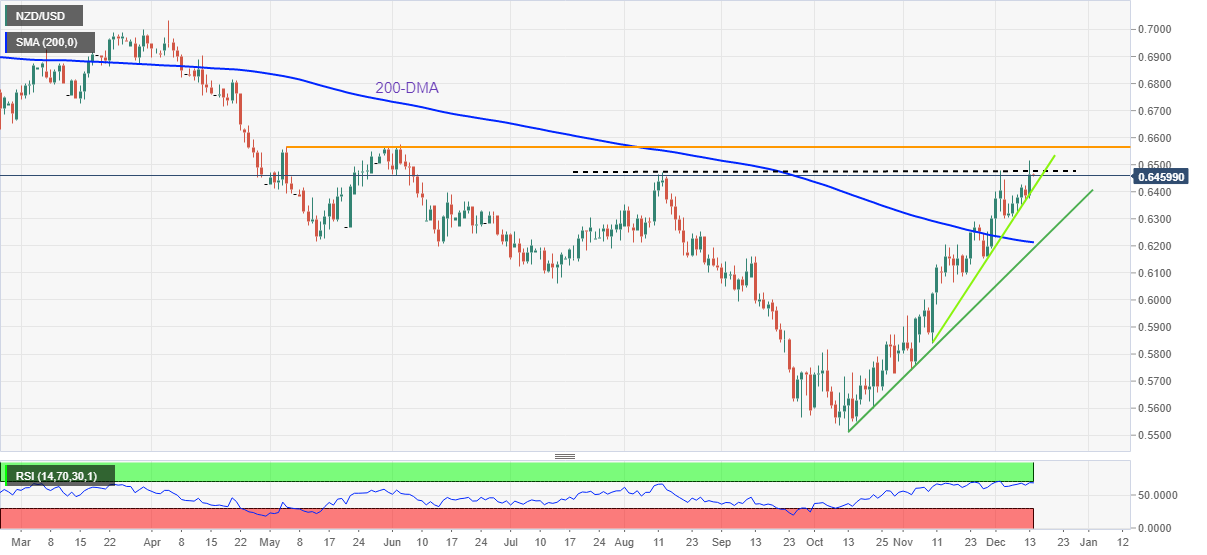
  • Overbought RSI conditions, four-month-old horizontal resistance challenge bulls.
  • Monthly support line, sustained trading beyond 200-DMA restrict bear’s entry.

NZD/USD remains sidelined around 0.6460 during Wednesday’s Asian session, after retreating from a six-month high before a few hours.

The quote rallied to the highest levels since June the previous day, and also posted the biggest daily gains in a fortnight, but failed to offer a daily closing beyond the key 0.6480 hurdle comprising tops marked in August, as well as during early December.

The pullback move also took clues from the overbought RSI conditions, suggesting further profit-booking on the road.

Though, an upward-sloping support line from early November, close to 0.6415 by the press time, puts a floor under the NZD/USD prices.

In a case where the Kiwi pair drops below 0.6415 support, a slump towards the November 29 peak of 0.6290 and then to the 200-DMA support of 0.6213 can’t be ruled out. However, a two-month-old ascending support line near 0.6190 could defend the bulls afterward.

On the flip side, a successful break of 0.6480 could propel the NZD/USD prices toward the tops marked in May and June, around 0.6568-75. Following that, a run-up towards March’s low near 0.6730 becomes more likely.

Overall, NZD/USD bulls stay in the driver’s seat but the pair’s further upside hinges on the 0.6480 breakout.

NZD/USD: Daily chart

Trend: Pullback expected

Additional important levels

Overview
Today last price0.646
Today Daily Change0.0074
Today Daily Change %1.16%
Today daily open0.6386
 
Trends
Daily SMA200.6261
Daily SMA500.5967
Daily SMA1000.6035
Daily SMA2000.6278
 
Levels
Previous Daily High0.6423
Previous Daily Low0.6365
Previous Weekly High0.6444
Previous Weekly Low0.6302
Previous Monthly High0.6314
Previous Monthly Low0.5741
Daily Fibonacci 38.2%0.6387
Daily Fibonacci 61.8%0.6401
Daily Pivot Point S10.636
Daily Pivot Point S20.6334
Daily Pivot Point S30.6303
Daily Pivot Point R10.6418
Daily Pivot Point R20.6449
Daily Pivot Point R30.6475

Author

Anil Panchal

Anil Panchal

FXStreet

Anil Panchal has nearly 15 years of experience in tracking financial markets. With a keen interest in macroeconomics, Anil aptly tracks global news/updates and stays well-informed about the global financial moves and their implications.

More from Anil Panchal
Share:

Editor's Picks

EUR/USD falls to near 1.1600 due to persistent bearish bias

EUR/USD depreciates after registering modest gains in the previous session, trading around 1.1610 during the Asian hours on Thursday. The technical analysis of the daily chart suggests a persistent bearish bias as the EUR/USD pair remains within the descending channel pattern.

GBP/USD underperforms as UK faces stagflation risks amid Middle East war

The Pound Sterling trades lower against its major currency peers, is down 0.22% around 1.3340 against the US Dollar, during the Asian trade on Thursday. The British currency faces selling pressures amid fears that the United Kingdom economy could face stagflation risks due to higher energy prices, a situation in which inflation accelerates with economic growth and employment conditions remaining stagnant.

Gold climbs near $5,200 as Iran war fuels safe-haven demand

Gold price extends its gains for the second successive session on Thursday as traders seek safety amid the ongoing war in the Middle East. US and Israeli strikes across Iranian territory and widespread Iranian missile and drone retaliation across the Middle East, including attacks on regional targets and military sites, prolong the crisis and its impact.

Top Crypto Gainers: Decred, Zcash, and Dogecoin lead recovery as Bitcoin crosses $72,000

Bitcoin trades above $72,500 at press time on Thursday, holding its 6% gain from the previous day, contributing to a broader market recovery. The total cryptocurrency market capitalization stands at over $2.43 trillion as the broader market sentiment improves significantly.

First Venezuela, now Iran: The US-China energy war escalates

At first glance, the latest escalation involving the United States with both Iran and Venezuela looks like another chapter in a long-running geopolitical story. But viewed through a broader strategic lens, something else may be unfolding: Energy.

Cardano Price Analysis: Approaches key trendline amid bearish sentiment

Cardano (ADA) price is approaching its descending trendline around $0.28 at the time of writing, set to shape the next directional move. The derivatives metrics paint a bearish picture, with ADA’s Open Interest continuing to fall and short bets rising among traders.