|

NZD/USD Price Analysis: Bulls maintain momentum, eyes on bullish crossover

  • The daily indicators remain in positive territory but somewhat flattened .
  • The hourly charts reveal a temporary dip in the RSI and a MACD flattening, signaling a possible short-term consolidation.
  • Pending bullish crossover between the 200 and 100-day SMA at 0.6040 could bolster the bullish momentum in future sessions.

During Friday's session, NZD/USD rose towards the 0.6125 level. The positive trajectory of the pair continues to convey a strong buyer influence in the market. However, echoes of consolidation may suggest a breather following the recent surge which pushed the pair above the 100 and 200-day Simple Moving Averages (SMA).

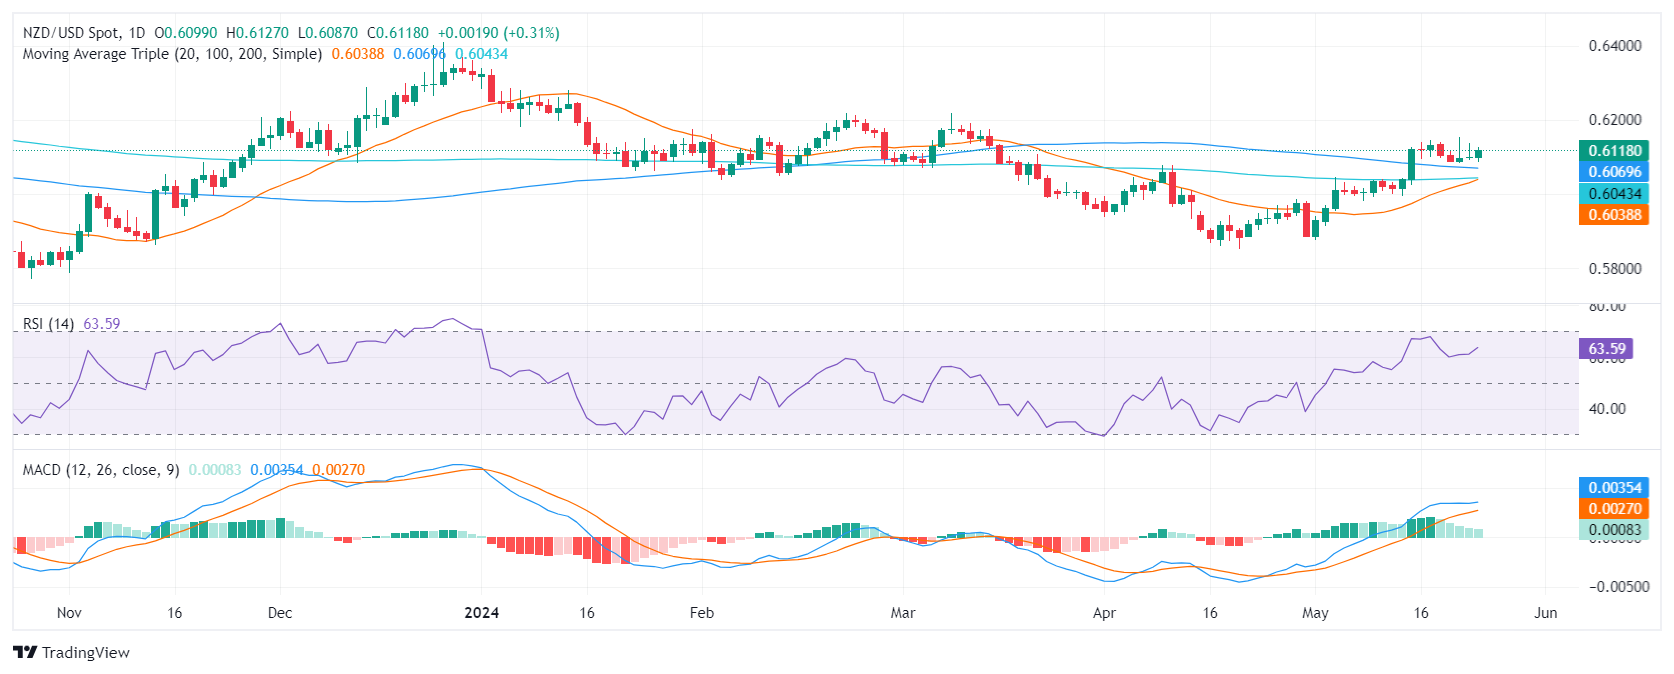
Examining the daily chart of the NZD/ pair, it is apparent that the Relative Strength Index (RSI) reveals a robust positive trend. After a close approach to overbought conditions at 69, the RSI receded to a still positive level of 63. In line with that, the Moving Average Convergence Divergence (MACD) prints flat green bars which may suggest a flattening momentum.

NZD/USD daily chart

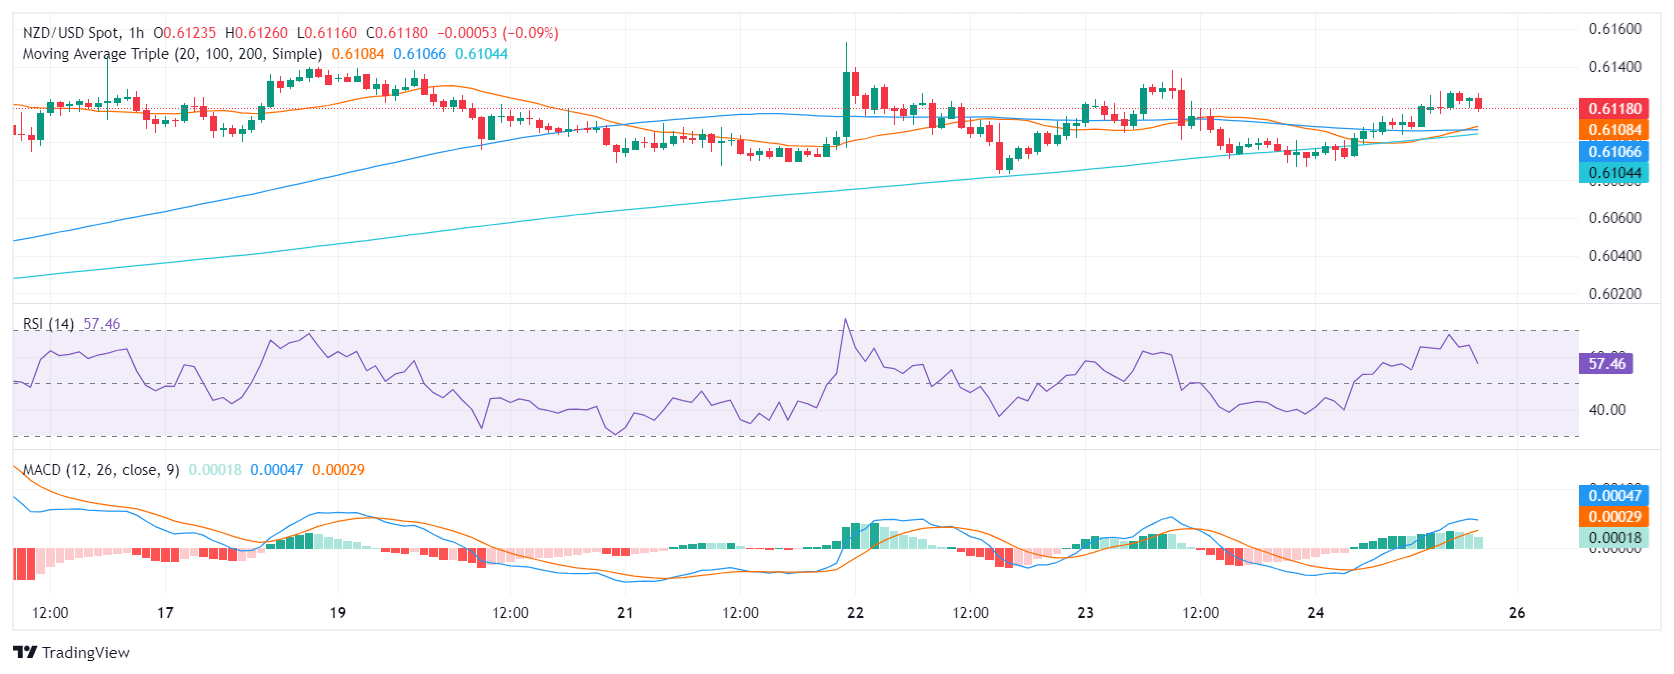
Transitioning to the hourly chart, there is a discernible decreasing trend in the RSI readings, with figures retreating from 64 to 57 throughout Friday’s session. The MACD histogram aligns with this pattern, with flat green bars that signal reduced upward momentum.

NZD/USD hourly chart

From a broader perspective, the position of NZD/USD suggests a strong bullish trend. Trading above the Simple Moving Averages (SMA) of 20, 100, and 200-day, the pair displays upward momentum both on short-term and long-term scales.

Incorporating both the daily and hourly RSI trends, along with MACD and SMA positioning, the conclusion is drawn that the NZD/USD may need some respite after its recent surge. Despite this, the market structure maintains its bullish tone.

NZD/USD

Overview
Today last price0.6118
Today Daily Change0.0019
Today Daily Change %0.31
Today daily open0.6099
 
Trends
Daily SMA200.603
Daily SMA500.6003
Daily SMA1000.6071
Daily SMA2000.6042
 
Levels
Previous Daily High0.6138
Previous Daily Low0.6091
Previous Weekly High0.6146
Previous Weekly Low0.5995
Previous Monthly High0.6079
Previous Monthly Low0.5851
Daily Fibonacci 38.2%0.612
Daily Fibonacci 61.8%0.6109
Daily Pivot Point S10.6081
Daily Pivot Point S20.6062
Daily Pivot Point S30.6033
Daily Pivot Point R10.6128
Daily Pivot Point R20.6157
Daily Pivot Point R30.6175

Author

Patricio Martín

Patricio is an economist from Argentina passionate about global finance and understanding the daily movements of the markets.

More from Patricio Martín
Share:

Markets move fast. We move first.

Orange Juice Newsletter brings you expert driven insights - not headlines. Every day on your inbox.

By subscribing you agree to our Terms and conditions.

Editor's Picks

EUR/USD recovers to 1.1750 region as 2025 draws to a close

Following the bearish action seen in the European session on Wednesday, EUR/USD regains its traction and recovery to the 1.1750 region. Nevertheless, the pair's volatility remains low as trading conditions thin out on the last day of the year.

GBP/USD stays weak near 1.3450 on modest USD recovery

GBP/USD remains under modest beairsh pressure and fluctuates at around 1.3450 on Wednesday. The US Dollar finds fresh demand due to the end-of-the-year position adjustments, weighing on the pair amid the pre-New Year trading lull. 

Gold retreats to $4,300 area, looks to post monthly gains

Gold stays on the back foot on the last day of 2025 and trades near $4,300, possibly pressured by profit-taking and position adjustments. Nevertheless, XAU/USD remains on track to post gains for December and extend its winning streak into a fifth consecutive month.

Bitcoin, Ethereum and XRP prepare for a potential New Year rebound

Bitcoin, Ethereum, and Ripple are holding steady on Wednesday after recording minor gains on the previous day. Technically, Bitcoin could extend gains within a triangle pattern while Ethereum and Ripple face critical overhead resistance. 

Economic outlook 2026-2027 in advanced countries: Solidity test

After a year marked by global economic resilience and ending on a note of optimism, 2026 looks promising and could be a year of solid economic performance. In our baseline scenario, we expect most of the supportive factors at work in 2025 to continue to play a role in 2026.

Crypto market outlook for 2026

Year 2025 was volatile, as crypto often is.  Among positive catalysts were favourable regulatory changes in the U.S., rise of Digital Asset Treasuries (DAT), adoption of AI and tokenization of Real-World-Assets (RWA).