NZD/USD Price Analysis: Bulls have the upper hand while above 50/100-SMAs
- NZD/USD lacks any firm intraday direction on Thursday and oscillates in a narrow range.
- A modest USD uptick acts as a headwind, though the risk-on mood lends some support.
- The technical setup favours bulls and supports prospects for a further appreciating move.

The NZD/USD pair struggles to gain any meaningful traction and seesaws between tepid gains/minor losses during the Asian session on Thursday. Spot prices currently trade around the 0.6155-0.6160 region, unchanged for the day, and remain within the striking distance of over a two-week high touched last Friday.
A hot US inflation print earlier this week fuelled speculations that the Federal Reserve (Fed) may delay interest rate cuts, which keeps the US Treasury bond yields elevated. This, in turn, assists the US Dollar (USD) to attract some buyers and turns out to be a key factor acting as a headwind for the NZD/USD pair. That said, the underlying strong bullish sentiment across the global equity markets caps any further gains for the safe-haven buck and helps limit the downside for the risk-sensitive Kiwi.
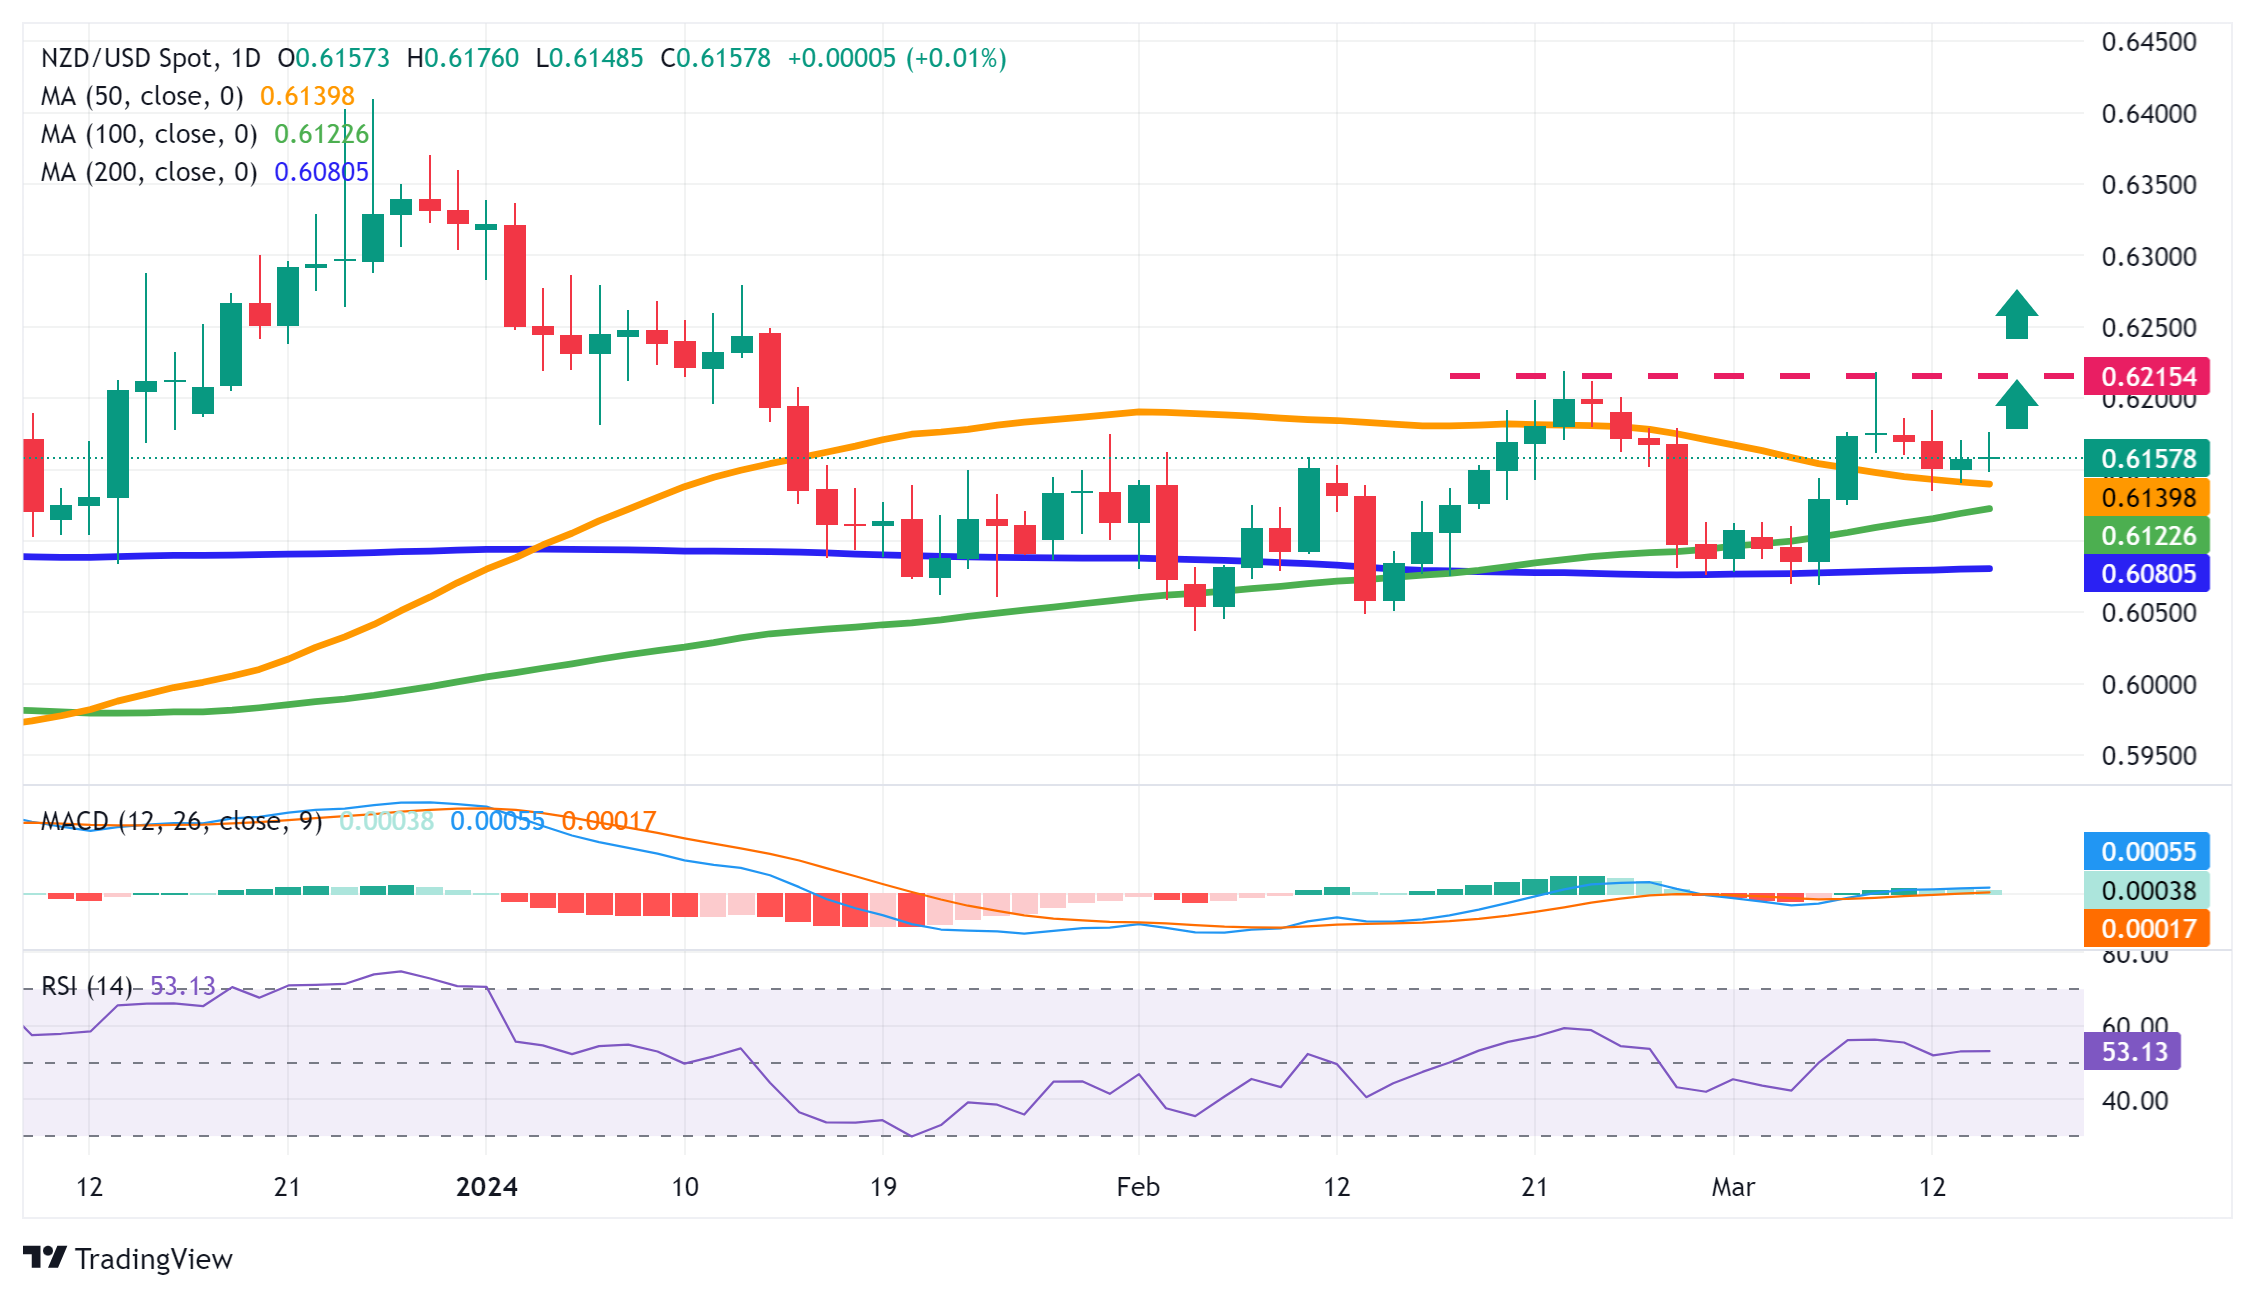
From a technical perspective, spot prices hold comfortably above the very important 200-day Simple Moving Average (SMA) and now seem to have found acceptance above the 50-day SMA. Furthermore, oscillators on the daily chart have just started gaining positive traction and suggest that the path of least resistance for the NZD/USD pair is to the upside. Bulls, however, need to wait for a sustained strength beyond the 0.6200 mark before positioning for any further appreciating move.
Some follow-through buying beyond the 0.6215-0.6220 region, or the monthly peak touched last Friday, will reaffirm the bullish bias and lift the NZD/USD pair to mid-0.6200s en route to the 0.6275-0.6280 supply zone. This is closely followed by the 0.6300 mark, which if cleared decisively should pave the way for a move towards the next relevant hurdle near the 0.6340-0.6350 zone. The momentum could extend further towards the December monthly swing high, around the 0.6400 round figure.
On the flip side, the 50-day SMA, currently pegged near the 0.6145-0.6140 region, should offer some immediate support ahead of the 0.6125 zone, or the 100-day SMA. A convincing break below could make the NZD/USD pair vulnerable to weaken further below the 0.6100 mark and test the 200-day SMA, around the 0.6080 region. Failure to defend the latter will expose the YTD low, around the 0.6040-0.6035 region, before spot prices eventually drop to the 0.6000 psychological mark,
NZD/USD daily chart
Author

Haresh Menghani
FXStreet
Haresh Menghani is a detail-oriented professional with 10+ years of extensive experience in analysing the global financial markets.


