|

NZD/USD Price Analysis: Bulls gather traction and brighten the outlook, indicators hit overbought conditions

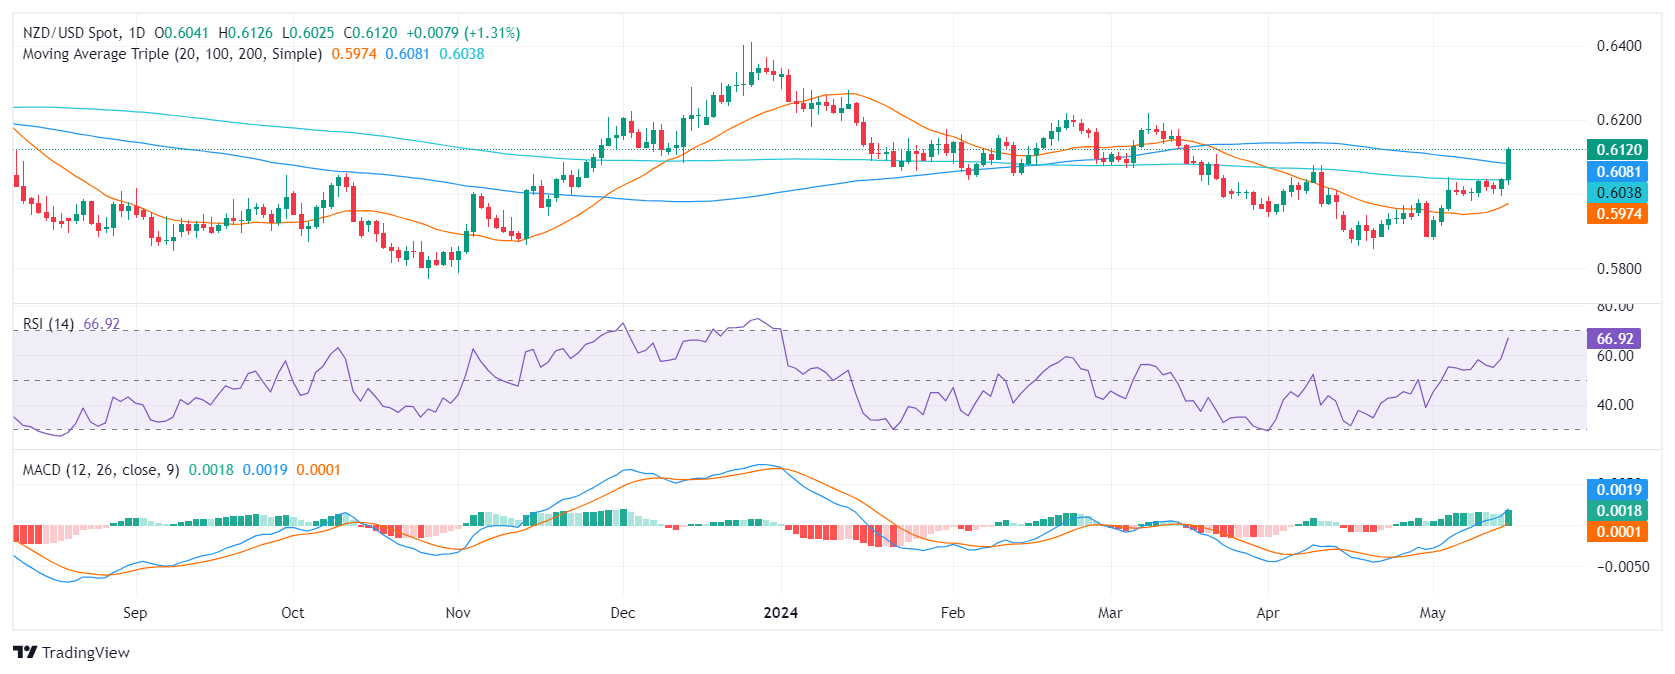
  • The daily RSI of the NZD/USD signals it is approaching overbought, which often indicates future consolidation or potential reversal.
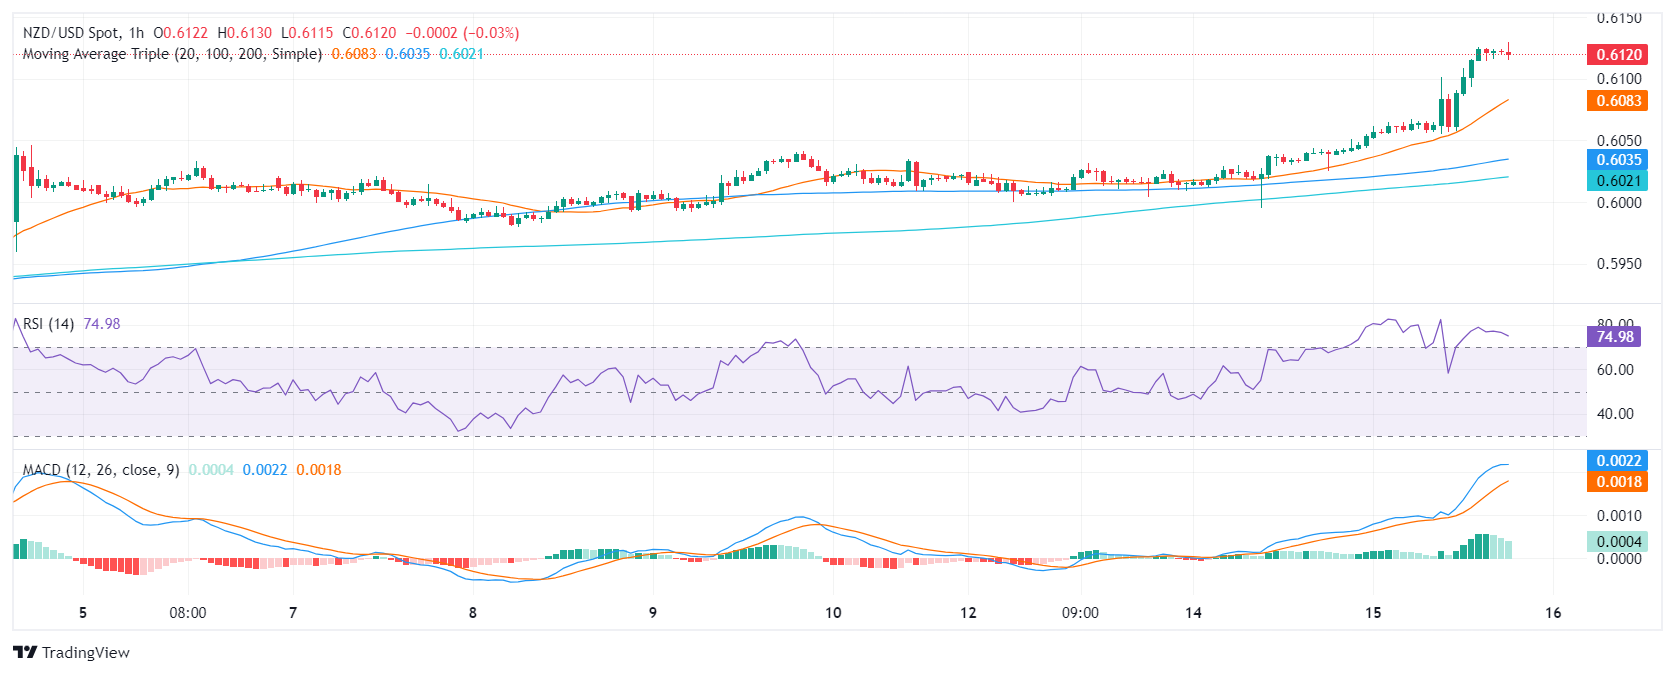
  • The same indicators in the hourly chart further strengthen this view, specifically, with the RSI crossing the 70 mark.
  • Buyers regained the 100 and 200-day SMAs, and this points to a bullish outlook.

In the Wednesday session, the NZD/USD pair rides a strong bullish wave, with a recent increase of 1.28%. The uptick made the pair jump above its 100 and 200-day Simple Moving Averages (SMAs), indicating that the outlook turned positive for the pair. However, as indicators approach overbought conditions, a consolidation may be incoming.

On the daily chart, the Relative Strength Index (RSI) indicates that NZD/USD is approaching overbought territory. The positive trend evident over the past few days, along with the recent surge, reveals that the strength is currently with buyers. However, this upward pressure may soon decrease, as the RSI nearing overbought conditions often signals future consolidation or potential reversal.

NZD/USD daily chart

The hourly chart shows that RSI readings exceeded 70, reinforcing indications of overbought conditions. The recent Moving Average Convergence Divergence (MACD) showing flat green bars indicates sustained but flat positive momentum.

NZD/USD hourly chart

In conclusion, the technical indicators for NZD/USD suggest strong buyer momentum. However, the RSI's proximity to overbought conditions hints at a potential easing of this upward pressure. This, coupled with the strong bullish trend indicated by the jumping above longer-term SMAs, presents a positive outlook but demands careful observation for potential corrections.

NZD/USD

Overview
Today last price0.6118
Today Daily Change0.0077
Today Daily Change %1.27
Today daily open0.6041
 
Trends
Daily SMA200.5964
Daily SMA500.6009
Daily SMA1000.6084
Daily SMA2000.6038
 
Levels
Previous Daily High0.6044
Previous Daily Low0.5995
Previous Weekly High0.6041
Previous Weekly Low0.598
Previous Monthly High0.6079
Previous Monthly Low0.5851
Daily Fibonacci 38.2%0.6025
Daily Fibonacci 61.8%0.6014
Daily Pivot Point S10.6009
Daily Pivot Point S20.5978
Daily Pivot Point S30.596
Daily Pivot Point R10.6058
Daily Pivot Point R20.6076
Daily Pivot Point R30.6107

Author

Patricio Martín

Patricio is an economist from Argentina passionate about global finance and understanding the daily movements of the markets.

More from Patricio Martín
Share:

Markets move fast. We move first.

Orange Juice Newsletter brings you expert driven insights - not headlines. Every day on your inbox.

By subscribing you agree to our Terms and conditions.

Editor's Picks

EUR/USD moves sideways below 1.1800 on Christmas Eve

EUR/USD struggles to find direction and trades in a narrow channel below 1.1800 after posting gains for two consecutive days. Bond and stock markets in the US will open at the usual time and close early on Christmas Eve, allowing the trading action to remain subdued. 

GBP/USD keeps range around 1.3500 amid quiet markets

GBP/USD keeps its range trade intact at around 1.3500 on Wednesday. The Pound Sterling holds the upper hand over the US Dollar amid pre-Christmas light trading as traders move to the sidelines heading into the holiday season. 

Gold retreats from record highs, trades below $4,500

Gold retreats after setting a new record-high above $4,520 earlier in the day and trades in a tight range below $4,500 as trading volumes thin out ahead of the Christmas break. The US Dollar selling bias remains unabated on the back of dovish Fed expectations, which continues to act as a tailwind for the bullion amid persistent geopolitical risks.

Bitcoin slips below $87,000 as ETF outflows intensify, whale participation declines

Bitcoin price continues to trade around $86,770 on Wednesday, after failing to break above the $90,000 resistance. US-listed spot ETFs record an outflow of $188.64 million on Tuesday, marking the fourth consecutive day of withdrawals.

Economic outlook 2026-2027 in advanced countries: Solidity test

After a year marked by global economic resilience and ending on a note of optimism, 2026 looks promising and could be a year of solid economic performance. In our baseline scenario, we expect most of the supportive factors at work in 2025 to continue to play a role in 2026.

Avalanche struggles near $12 as Grayscale files updated form for ETF

Avalanche trades close to $12 by press time on Wednesday, extending the nearly 2% drop from the previous day. Grayscale filed an updated form to convert its Avalanche-focused Trust into an ETF with the US Securities and Exchange Commission.