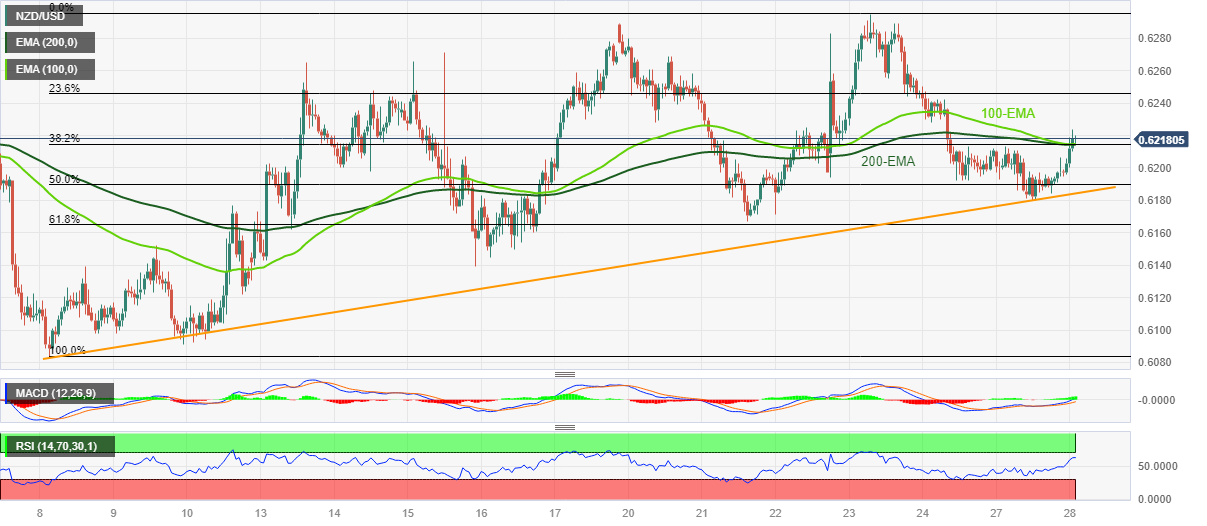
NZD/USD Price Analysis: Bulls cross 0.6215 EMA confluence to retake control


  • NZD/USD picks up bids to refresh intraday high, snaps two-day downtrend.
  • Clear break of 100-EMA, 200-EMA convergence joins upbeat oscillators to favor Kiwi pair bulls.
  • Sellers need validation from three-week-old ascending trend line to retake control.

NZD/USD bulls are back to the table, after a two-day absence, as the Kiwi pair renews its intraday high around 0.6220 during early Tuesday.

In doing so, the major currency pair justifies the previous day’s U-turn from a three-week-old ascending trend line, as well as the successful upside break of the key Exponential Moving Averages (EMAs). Also adding strength to the upside bias are the bullish MACD signals and the upbeat RSI (14) line, not overbought.

With this, the NZD/USD pair is well set for the upside momentum even if multiple hurdles around 0.6250 and 0.6270 could test the buyers before directing them to the monthly high of around 0.6295.

It’s worth noting that the Kiwi pair’s run-up beyond 0.6295 needs validation from the 0.6300 round figure before directing the bulls toward the mid-February swing high of around 0.6390.

On the contrary, a convergence of the 100-EMA and 200-EMA joins the 38.2% Fibonacci retracement level of the NZD/USD pair’s March 08-23 run-up to highlight 0.6215 as the strong downside support.

Following that, the aforementioned ascending trend line from March 08, close to 0.6185 by the press time, may challenge the NZD/USD bears.

NZD/USD: Hourly chart

Trend: Further upside expected

Additional important levels

Overview
Today last price 0.6218
Today Daily Change 0.0021
Today Daily Change % 0.34%
Today daily open 0.6197
 
Trends
Daily SMA20 0.6198
Daily SMA50 0.6293
Daily SMA100 0.6285
Daily SMA200 0.616
 
Levels
Previous Daily High 0.6213
Previous Daily Low 0.618
Previous Weekly High 0.6295
Previous Weekly Low 0.6167
Previous Monthly High 0.6538
Previous Monthly Low 0.6131
Daily Fibonacci 38.2% 0.6193
Daily Fibonacci 61.8% 0.62
Daily Pivot Point S1 0.618
Daily Pivot Point S2 0.6164
Daily Pivot Point S3 0.6147
Daily Pivot Point R1 0.6213
Daily Pivot Point R2 0.623
Daily Pivot Point R3 0.6246


Share: Feed news

Information on these pages contains forward-looking statements that involve risks and uncertainties. Markets and instruments profiled on this page are for informational purposes only and should not in any way come across as a recommendation to buy or sell in these assets. You should do your own thorough research before making any investment decisions. FXStreet does not in any way guarantee that this information is free from mistakes, errors, or material misstatements. It also does not guarantee that this information is of a timely nature. Investing in Open Markets involves a great deal of risk, including the loss of all or a portion of your investment, as well as emotional distress. All risks, losses and costs associated with investing, including total loss of principal, are your responsibility. The views and opinions expressed in this article are those of the authors and do not necessarily reflect the official policy or position of FXStreet nor its advertisers. The author will not be held responsible for information that is found at the end of links posted on this page.

If not otherwise explicitly mentioned in the body of the article, at the time of writing, the author has no position in any stock mentioned in this article and no business relationship with any company mentioned. The author has not received compensation for writing this article, other than from FXStreet.

FXStreet and the author do not provide personalized recommendations. The author makes no representations as to the accuracy, completeness, or suitability of this information. FXStreet and the author will not be liable for any errors, omissions or any losses, injuries or damages arising from this information and its display or use. Errors and omissions excepted.

The author and FXStreet are not registered investment advisors and nothing in this article is intended to be investment advice.

Recommended content


Recommended content

Editors’ Picks

AUD/USD remained bid above 0.6500

AUD/USD remained bid above 0.6500

AUD/USD extended further its bullish performance, advancing for the fourth session in a row on Thursday, although a sustainable breakout of the key 200-day SMA at 0.6526 still remain elusive.

AUD/USD News

EUR/USD faces a minor resistance near at 1.0750

EUR/USD faces a minor resistance near at 1.0750

EUR/USD quickly left behind Wednesday’s small downtick and resumed its uptrend north of 1.0700 the figure, always on the back of the persistent sell-off in the US Dollar ahead of key PCE data on Friday.

EUR/USD News

Gold holds around $2,330 after dismal US data

Gold holds around $2,330 after dismal US data

Gold fell below $2,320 in the early American session as US yields shot higher after the data showed a significant increase in the US GDP price deflator in Q1. With safe-haven flows dominating the markets, however, XAU/USD reversed its direction and rose above $2,340.

Gold News

Bitcoin price continues to get rejected from $65K resistance as SEC delays decision on spot BTC ETF options

Bitcoin price continues to get rejected from $65K resistance as SEC delays decision on spot BTC ETF options

Bitcoin (BTC) price has markets in disarray, provoking a broader market crash as it slumped to the $62,000 range on Thursday. Meanwhile, reverberations from spot BTC exchange-traded funds (ETFs) continue to influence the market.

Read more

US economy: slower growth with stronger inflation

US economy: slower growth with stronger inflation

The dollar strengthened, and stocks fell after statistical data from the US. The focus was on the preliminary estimate of GDP for the first quarter. Annualised quarterly growth came in at just 1.6%, down from the 2.5% and 3.4% previously forecast.

Read more

Forex MAJORS

Cryptocurrencies

Signatures