|

NZD/USD Price Analysis: Bears weaken as bullish momentum hints at possible recovery

  • The daily chart reveals a shift in NZD/USD from a bearish to a bullish short-term outlook.
  • Hourly chart indicators echo the bullish trend visible in the daily analysis.
  • Buyers will need to claim dominance over key SMAs to make strides in the market.

The NZD/USD rose to around 0.6058, reflecting a 0.41% gain on Tuesday's session. Despite the pair experiencing a momentum shift from bearish to bullish, it is positioned beneath key Simple Moving Averages (SMAs), hinting at a possible extended downtrend.

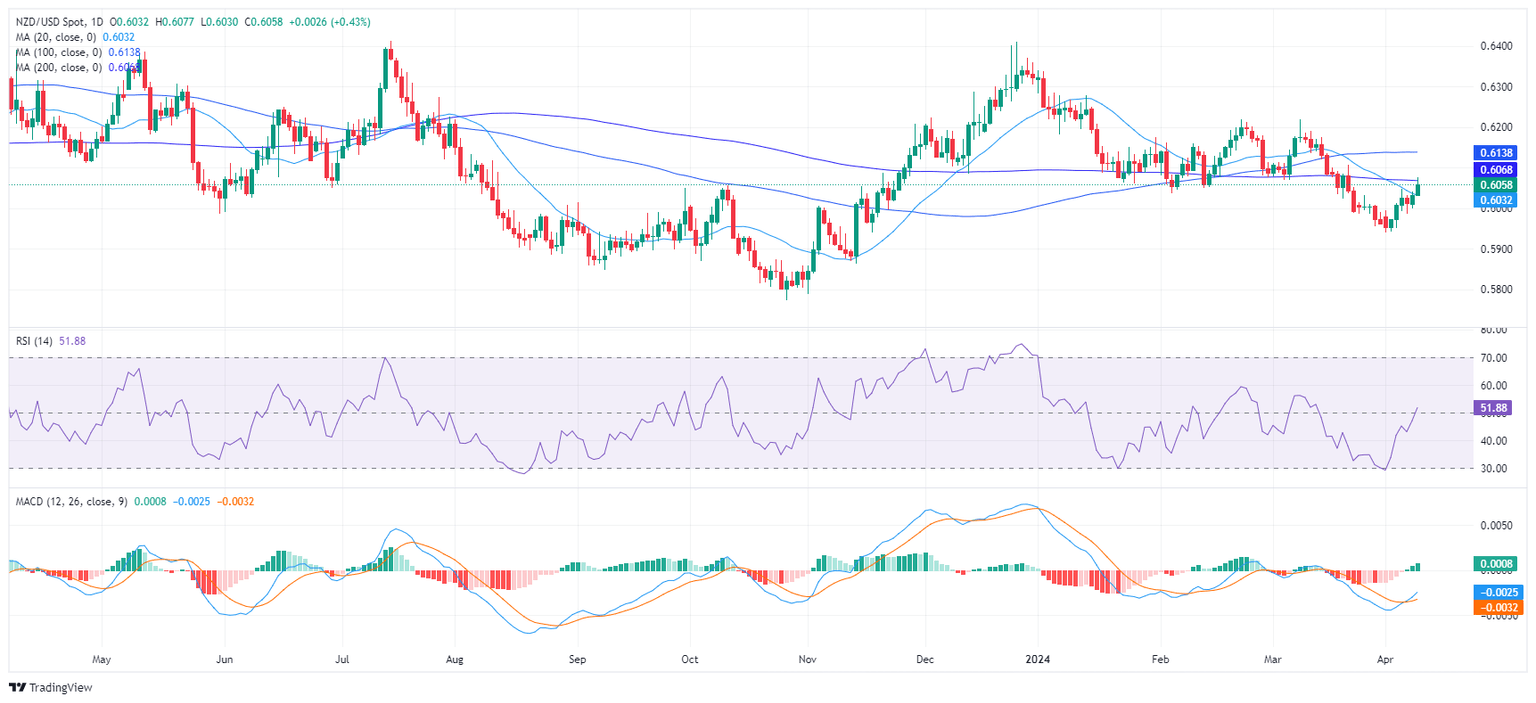
On the daily chart, the Relative Strength Index (RSI) rose from negative territory and is now within the positive zone. This indicates a reversal from a bearish trend to a bullish short-term outlook. Further strengthening that, the Moving Average Convergence Divergence (MACD) histogram prints rising green bars for the first time since mid-March, signaling a potential upward momentum.

NZD/USD daily chart

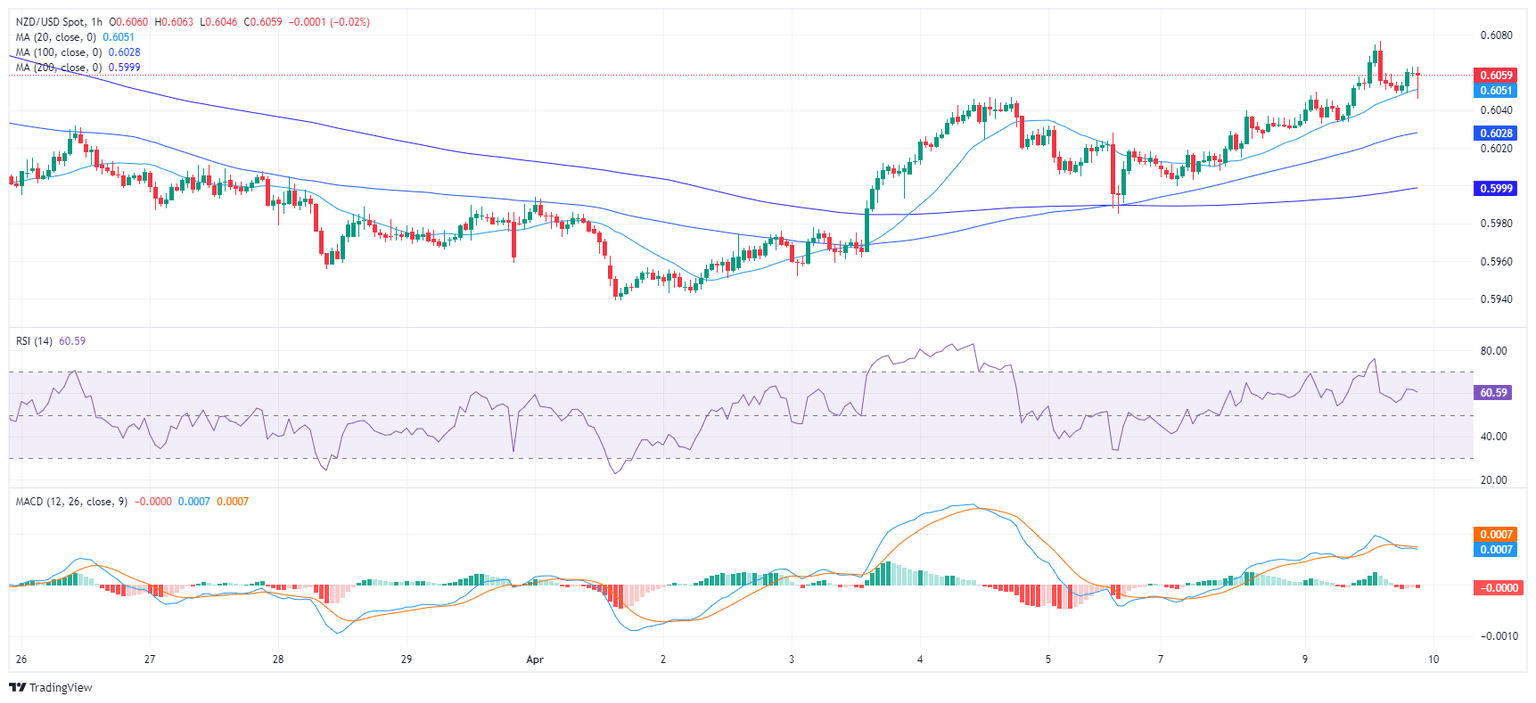
Turning to the hourly chart, the RSI is on the rise, mirroring the trend found on the daily chart. The MACD histogram on the hourly scale is relatively flat but displays red bars, indicating a mild negative momentum, probably hinting that the bulls are taking profits after the RSI hit overbought conditions earlier in the session.

NZD/USD hourly chart

Regarding the overall trend, the NZD/USD has demonstrated a significant jump above its 20-day Simple Moving Average (SMA), suggesting a bullish shift in the short-term outlook. This development indicates that the pair has found some near-term buying strength. However, it continues to be positioned below both the 100 and 200-day SMA, implying a long-term bearish stance. Further to this, the pair was recently rejected by its 100-day SMA at 0.6138, suggesting a reinforced resistance at this level. A sustained move above this level would be required to alter the overall bearish bias.

NZD/USD

Overview
Today last price0.6059
Today Daily Change0.0027
Today Daily Change %0.45
Today daily open0.6032
 
Trends
Daily SMA200.6036
Daily SMA500.6091
Daily SMA1000.6138
Daily SMA2000.6068
 
Levels
Previous Daily High0.604
Previous Daily Low0.6
Previous Weekly High0.6047
Previous Weekly Low0.5939
Previous Monthly High0.6218
Previous Monthly Low0.5956
Daily Fibonacci 38.2%0.6025
Daily Fibonacci 61.8%0.6015
Daily Pivot Point S10.6008
Daily Pivot Point S20.5984
Daily Pivot Point S30.5968
Daily Pivot Point R10.6048
Daily Pivot Point R20.6064
Daily Pivot Point R30.6088

Author

Patricio Martín

Patricio is an economist from Argentina passionate about global finance and understanding the daily movements of the markets.

More from Patricio Martín
Share:

Markets move fast. We move first.

Orange Juice Newsletter brings you expert driven insights - not headlines. Every day on your inbox.

By subscribing you agree to our Terms and conditions.

Editor's Picks

EUR/USD trims some losses, approaches 1.1600

EUR/USD remains under pressure on Monday, hovering around the 1.1600 level as the NA session winds down. On the flip side, the US Dollar is finding fresh momentum with risk appetite fading and markets scaling back expectations for a December Fed rate cut.

GBP/USD remains slightly offered near 1.3160

GBP/USD is slipping again on Monday, extending Friday’s pullback and orbiting around 1.3160 as the Greenback stages a decent bounce. In the meantime, sentiment toward the Sterling remains cautious, with UK fiscal concerns still hanging over the market and keeping buyers on the defensive.

Gold in wait-and-see mode near $4,000

Gold accelerates its losses at the beginning of the week, trading dangerously close to the $4,000 yardstick per troy ounce. Recent comments from key FOMC officials showed little enthusiasm for additional rate cuts, leading traders to pare back expectations for another Fed move, and leaving the yellow metal without a clear catalyst for now.

Crypto Today: Bitcoin, Ethereum, XRP hold near support amid continued capitulation, deleveraging 

Bitcoin offers subtle signs of recovery, trading above $95,000 at the time of writing on Monday. Altcoins, including Ethereu and Ripple, are making recovery attempts, following in BTC's footsteps, with ETH hovering below $3,200 and XRP trading around $2.27.

The week ahead: US economic data back in focus, and can Nvidia save the day for tech?

At the start of a new week, the market mood has calmed. US stock futures are pointing to small gains later on Monday, after a sharp sell off on Friday, European stock index futures are mostly flat at the start of the week.

Chainlink bulls defend key support, but low retail interest signals caution

Chainlink trades above $14.00 on Monday, as the cryptocurrency market generally recovers from last week’s volatility. LINK faces declining retail interest amid a weak derivatives market characterised by suppressed Open Interest.