|

NZD/USD Price Analysis: Aims to retest the five-month high, Hovers around 0.6220

  • NZD/USD extends its gains amid the improved Kiwi Manufacturing Index.
  • Business NZ PMI advanced to 46.7 in November from the previous readings of 42.5.
  • Technical indicators suggest retesting the five-month high at 0.6249.

NZD/USD continues its winning streak for the fifth successive day on the downbeat US Dollar (USD). The NZD/USD pair trades around 0.6220 during the European hours on Friday. Investors are expected to closely monitor the S&P Global Purchasing Managers Index (PMI) data on Friday.

Even positive economic data from the United States (US), including a 0.3% increase in Retail Sales (MoM) for November and reduced Initial Jobless Claims at 202K, failed to underpin the USD. Moreover, the Kiwi Business NZ PMI for November rose to 46.7 from the previous 42.5, which might have provided upward support for the New Zealand Dollar (NZD).

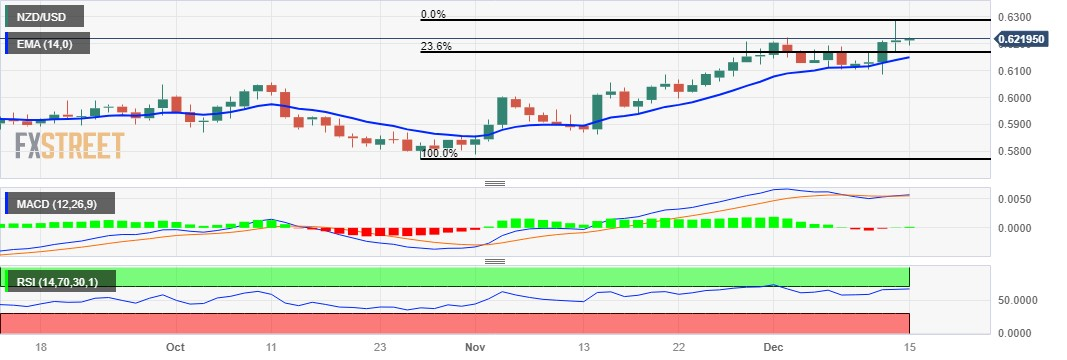
The 14-day Relative Strength Index (RSI) is above the 50 level, indicating a bullish sentiment, which suggests that the NZD/USD pair could retest the five-month high at 0.6249 lined up with the 0.6250 major level. If the NZD/USD pair manages to surpass the resistance area, it might find support to venture into the psychological region near 0.6300.

Additionally, the positive positioning of the Moving Average Convergence Divergence (MACD) line above both the centerline and the signal line could serve as confirmation of bullish momentum in the market.

On the downside, a break below the psychological support level of 0.6200 could push the pair to fall to the 23.6% Fibonacci retracement at 0.6165 before the major support at 0.6150. A decisive break below the level could lead the NZD/USD pair to navigate the region around the 14-day Exponential Moving Average (EMA) at 0.6149.

NZD/USD: Daily Chart:

NZD/USD: more technical levels to watch

Overview
Today last price0.6219
Today Daily Change0.0007
Today Daily Change %0.11
Today daily open0.6212
 
Trends
Daily SMA200.6119
Daily SMA500.5993
Daily SMA1000.598
Daily SMA2000.6089
 
Levels
Previous Daily High0.6287
Previous Daily Low0.6168
Previous Weekly High0.6223
Previous Weekly Low0.6103
Previous Monthly High0.6208
Previous Monthly Low0.5788
Daily Fibonacci 38.2%0.6242
Daily Fibonacci 61.8%0.6214
Daily Pivot Point S10.6158
Daily Pivot Point S20.6104
Daily Pivot Point S30.6039
Daily Pivot Point R10.6277
Daily Pivot Point R20.6341
Daily Pivot Point R30.6395

Author

Akhtar Faruqui

Akhtar Faruqui is a Forex Analyst based in New Delhi, India. With a keen eye for market trends and a passion for dissecting complex financial dynamics, he is dedicated to delivering accurate and insightful Forex news and analysis.

More from Akhtar Faruqui
Share:

Markets move fast. We move first.

Orange Juice Newsletter brings you expert driven insights - not headlines. Every day on your inbox.

By subscribing you agree to our Terms and conditions.

Editor's Picks

EUR/USD moves sideways below 1.1800 on Christmas Eve

EUR/USD struggles to find direction and trades in a narrow channel below 1.1800 after posting gains for two consecutive days. Bond and stock markets in the US will open at the usual time and close early on Christmas Eve, allowing the trading action to remain subdued. 

GBP/USD keeps range around 1.3500 amid quiet markets

GBP/USD keeps its range trade intact at around 1.3500 on Wednesday. The Pound Sterling holds the upper hand over the US Dollar amid pre-Christmas light trading as traders move to the sidelines heading into the holiday season. 

Gold retreats from record highs, trades below $4,500

Gold retreats after setting a new record-high above $4,520 earlier in the day and trades in a tight range below $4,500 as trading volumes thin out ahead of the Christmas break. The US Dollar selling bias remains unabated on the back of dovish Fed expectations, which continues to act as a tailwind for the bullion amid persistent geopolitical risks.

Bitcoin slips below $87,000 as ETF outflows intensify, whale participation declines

Bitcoin price continues to trade around $86,770 on Wednesday, after failing to break above the $90,000 resistance. US-listed spot ETFs record an outflow of $188.64 million on Tuesday, marking the fourth consecutive day of withdrawals.

Economic outlook 2026-2027 in advanced countries: Solidity test

After a year marked by global economic resilience and ending on a note of optimism, 2026 looks promising and could be a year of solid economic performance. In our baseline scenario, we expect most of the supportive factors at work in 2025 to continue to play a role in 2026.

Avalanche struggles near $12 as Grayscale files updated form for ETF

Avalanche trades close to $12 by press time on Wednesday, extending the nearly 2% drop from the previous day. Grayscale filed an updated form to convert its Avalanche-focused Trust into an ETF with the US Securities and Exchange Commission.