NZD/USD Price Analysis: 50-EMA, RSI divergence probe bulls at monthly peak below 0.6600
- NZD/USD grinds higher around one-month high after rising the most in a fortnight.
- 50-EMA, bearish RSI divergence test buyers on their way to crossing May’s top.
- Convergence of 21-EMA and three-week-old rising trend line restricts immediate downside.

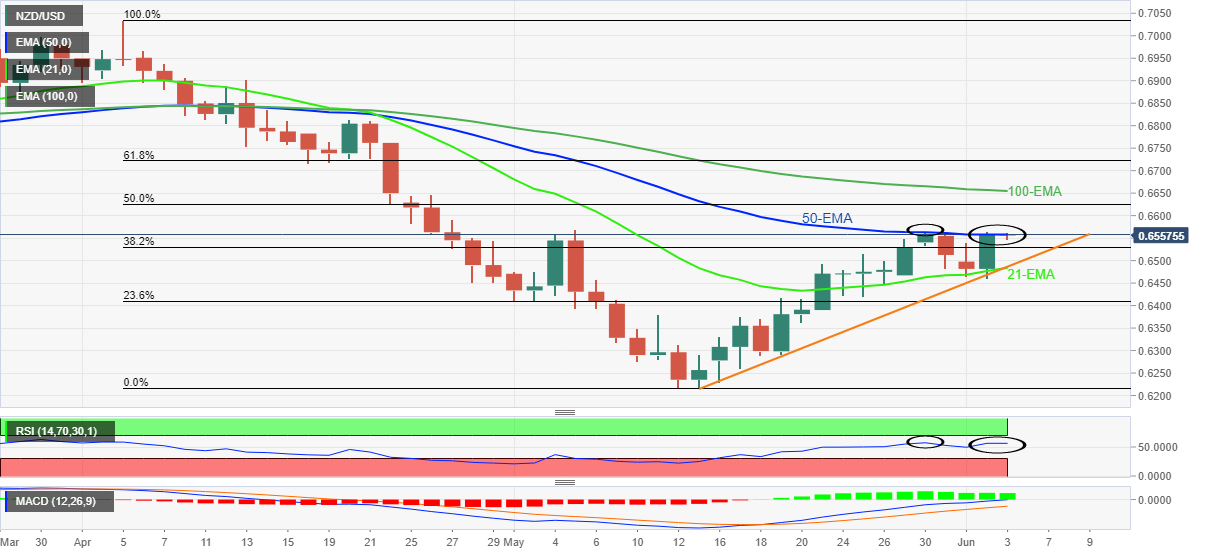
NZD/USD sits comfortably at its monthly peak, after taking the seat the previous day, as challenges to further upside emerge during Friday’s Asian session. That said, the Kiwi pair takes rounds to 0.6550-60 by the press time, following the run-up to 0.6565.
A sustained bounce off the 0.6480 confluence, comprising the 21-EMA and an upward sloping trend line from mid-May, joined bullish MACD signals to underpin the NZD/USD pair’s latest run-up.
However, the 50-EMA level surrounding 0.6570 and the RSI’s failures to march with the higher high, known as bearish divergence, challenge the pair’s latest upside moves.
In a case where the NZD/USD rises past the 0.6570 hurdle, it can extend the rally towards the 50% Fibonacci retracement (Fibo.) of April-May upside, near 0.6625, ahead of challenging the 100-EMA level surrounding 0.6655.
Alternatively, pullback moves may retest the 0.6500 round figure before the 0.6480 support convergence could challenge the bears.
It’s worth noting, however, that a clear downside break of 0.6480 won’t hesitate to drag the NZD/USD prices towards the 23.6% Fibo. level surrounding 0.6410.
NZD/USD: Daily chart
Trend: Pullback expected
Author

Anil Panchal
FXStreet
Anil Panchal has nearly 15 years of experience in tracking financial markets. With a keen interest in macroeconomics, Anil aptly tracks global news/updates and stays well-informed about the global financial moves and their implications.


