NZD/JPY Price Forecast: Climbs on eased US-China tensions
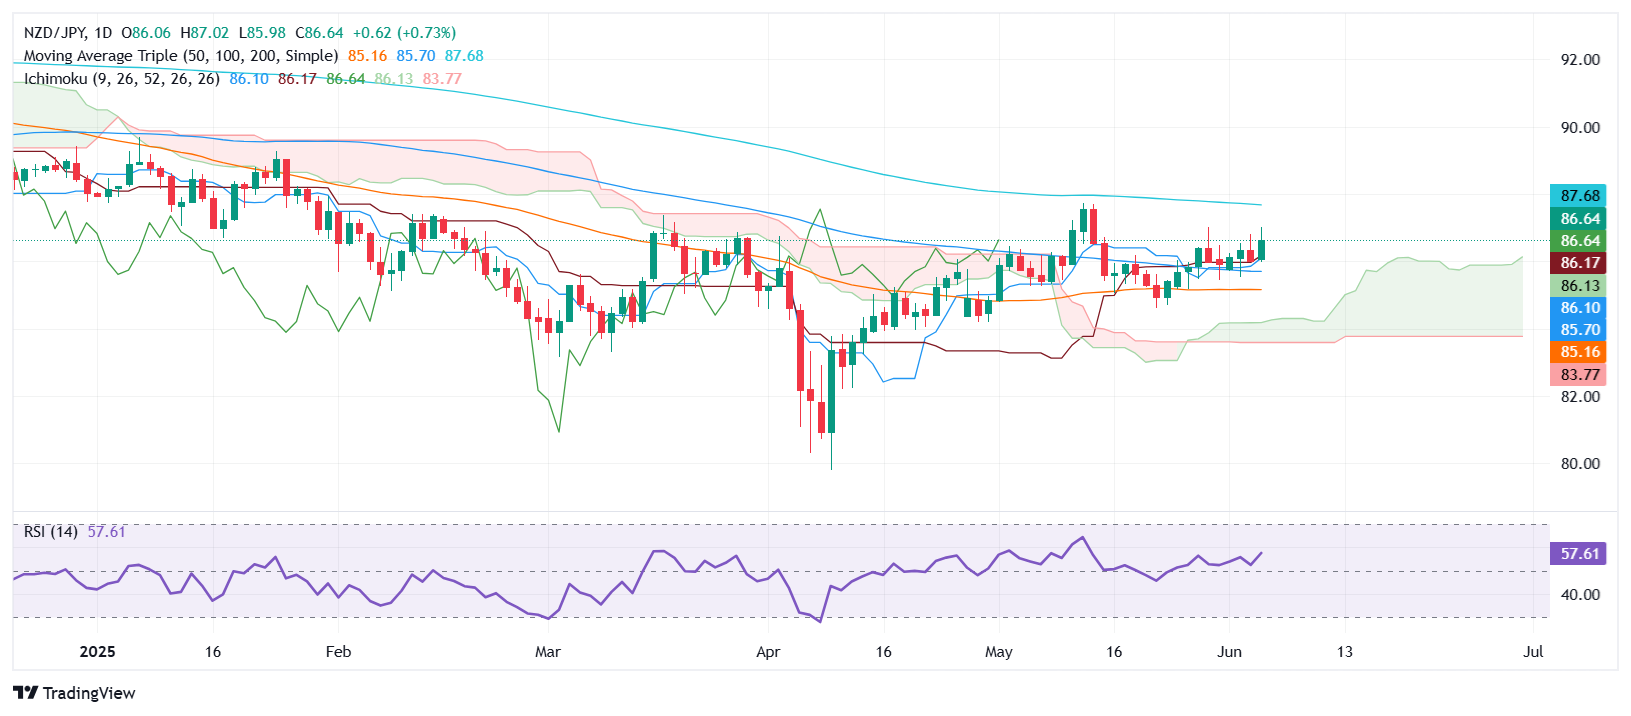
- NZD/JPY holds neutral-to-bullish structure, eyeing 87.01 and May 13 high at 87.73.
- Broader risk sentiment shrugs off Tesla’s 14% plunge as high-beta FX outperforms.
- Drop below 86.17 Kijun-sen could expose Kiwi to downside toward 85.00 and 84.30 support zone.

NZD/JPY climbed over 0.75% on Thursday amid a session that witnessed an escalation of the Trump-Musk fight on social media, which ultimately sent Testla (TSLA) stocks plunging over 14% during the day. Despite this, high-beta currencies in the FX space, like the Kiwi and the Aussie Dollar, advanced as tensions between Washington and Beijing eased. The pair trades at 86.55 at the time of writing.
NZD/JPY Price Forecast: Technical outlook
The NZD/JPY is neutral-biased, though it could shift slightly upwards if traders push prices above the May 29 high of 87.01, paving the path to challenge the May 13 high at 87.73. If cleared, the next stop would be the year-to-date (YTD) high of 89.70, ahead of the 90.00 figure.
Conversely, If NZD/JPY falls below the Kijun-sen at 86.17, it opens the door to fall toward the Tenkan-sen at 86.10. In the event of further weakness, the following support levels are 86.00, the 85.00 mark, and the top of the Ichimoku cloud (Kumo), which is around the 84.30/50 range.
NZD/JPY Price Chart – Daily
New Zealand Dollar PRICE This week
The table below shows the percentage change of New Zealand Dollar (NZD) against listed major currencies this week. New Zealand Dollar was the strongest against the US Dollar.
| USD | EUR | GBP | JPY | CAD | AUD | NZD | CHF | |
|---|---|---|---|---|---|---|---|---|
| USD | -0.88% | -0.81% | -0.24% | -0.49% | -1.08% | -1.21% | -0.48% | |
| EUR | 0.88% | 0.04% | 0.62% | 0.37% | -0.19% | -0.37% | 0.39% | |
| GBP | 0.81% | -0.04% | 0.62% | 0.32% | -0.25% | -0.42% | 0.35% | |
| JPY | 0.24% | -0.62% | -0.62% | -0.24% | -0.83% | -0.99% | -0.31% | |
| CAD | 0.49% | -0.37% | -0.32% | 0.24% | -0.59% | -0.75% | 0.02% | |
| AUD | 1.08% | 0.19% | 0.25% | 0.83% | 0.59% | -0.10% | 0.69% | |
| NZD | 1.21% | 0.37% | 0.42% | 0.99% | 0.75% | 0.10% | 0.77% | |
| CHF | 0.48% | -0.39% | -0.35% | 0.31% | -0.02% | -0.69% | -0.77% |
The heat map shows percentage changes of major currencies against each other. The base currency is picked from the left column, while the quote currency is picked from the top row. For example, if you pick the New Zealand Dollar from the left column and move along the horizontal line to the US Dollar, the percentage change displayed in the box will represent NZD (base)/USD (quote).
Author

Christian Borjon Valencia
FXStreet
Markets analyst, news editor, and trading instructor with over 14 years of experience across FX, commodities, US equity indices, and global macro markets.