NZD/JPY Price Forecast: Climbs higher but bulls struggle to clear 86.00 resistance
- NZD/JPY trades above Ichimoku Cloud, signaling bullish bias, yet momentum remains indecisive.
- RSI stuck at 50; bulls need break above 86.00 to aim for 87.73 and YTD high at 89.71.
- Failure to hold 84.61 may trigger decline toward key Kumo support near 83.50–83.75 zone.

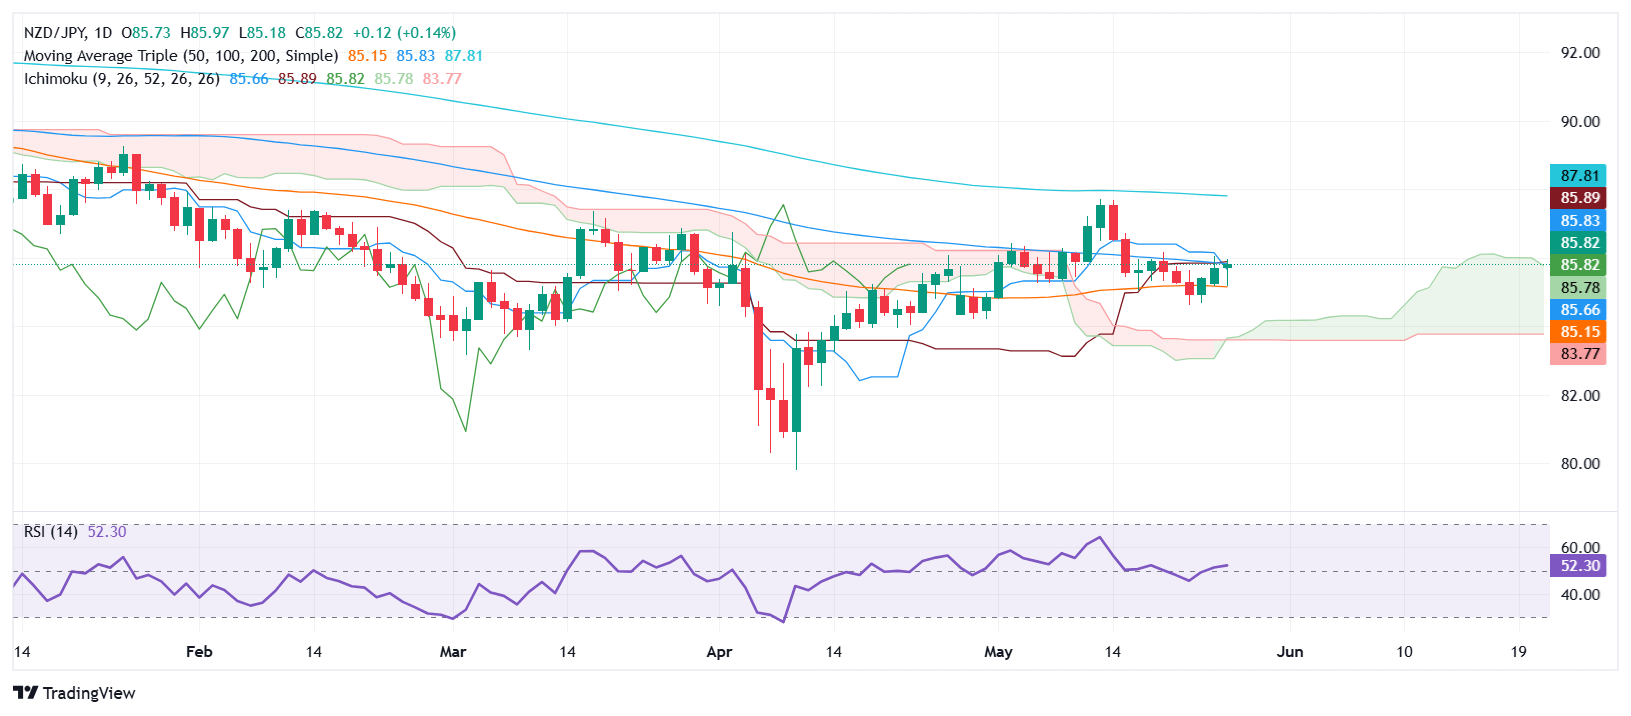
NZD/JPY extended its rally for the third consecutive day on Tuesday, rose a slim 0.17%, but failed to clear key resistance seen at the Kijun-Sen at 85.92 to challenge the 86.00 figure. As Wednesday’s Asian session begins, the cross-pair trades at 85.81 virtually unchanged.
NZD/JPY Price Forecast: Technical outlook
The pair continued to consolidate from a technical perspective, despite the fact that NZD/JPY spot prices is clearly above the Ichimoku Cloud (Kumo), an indication of bullishness. Nevertheless, failure to clear the 86.00 hurdle keeps sellers hopeful of dragging prices lower.
Momentum suggests that neither buyers nor sellers are in charge, with the Relative Strength Index (RSI) remaining at the 50-neutral line.
If bulls would like to regain control, they need a break above the Tenkan-sen and the 86.00 level could fuel upside momentum, allowing buyers to target the May 13 high at 87.73. A decisive move beyond that would expose the YTD peak at 89.71.
On the flipside, a drop below the May 22 low at 84.61 would signal weakness. If confirmed, the pair could decline toward the top of the Kumo cloud, located between 83.50 and 83.75.
NZD/JPY Price Chart – Daily
New Zealand Dollar PRICE This week
The table below shows the percentage change of New Zealand Dollar (NZD) against listed major currencies this week. New Zealand Dollar was the strongest against the Japanese Yen.
| USD | EUR | GBP | JPY | CAD | AUD | NZD | CHF | |
|---|---|---|---|---|---|---|---|---|
| USD | 0.29% | 0.13% | 1.23% | 0.54% | 0.68% | 0.63% | 0.75% | |
| EUR | -0.29% | -0.16% | 0.98% | 0.25% | 0.39% | 0.34% | 0.47% | |
| GBP | -0.13% | 0.16% | 0.80% | 0.41% | 0.55% | 0.50% | 0.64% | |
| JPY | -1.23% | -0.98% | -0.80% | -0.67% | -0.55% | -0.66% | -0.44% | |
| CAD | -0.54% | -0.25% | -0.41% | 0.67% | 0.15% | 0.09% | 0.23% | |
| AUD | -0.68% | -0.39% | -0.55% | 0.55% | -0.15% | -0.09% | 0.09% | |
| NZD | -0.63% | -0.34% | -0.50% | 0.66% | -0.09% | 0.09% | 0.14% | |
| CHF | -0.75% | -0.47% | -0.64% | 0.44% | -0.23% | -0.09% | -0.14% |
The heat map shows percentage changes of major currencies against each other. The base currency is picked from the left column, while the quote currency is picked from the top row. For example, if you pick the New Zealand Dollar from the left column and move along the horizontal line to the US Dollar, the percentage change displayed in the box will represent NZD (base)/USD (quote).
Author

Christian Borjon Valencia
FXStreet
Markets analyst, news editor, and trading instructor with over 14 years of experience across FX, commodities, US equity indices, and global macro markets.


