|

NZD/JPY Price Analysis: Struggles at 86.00, tumbles amid a risk-off mood

  • Despite a risk-off mood, the New Zealand Dollar recovered some ground vs. the Japanese Yen.
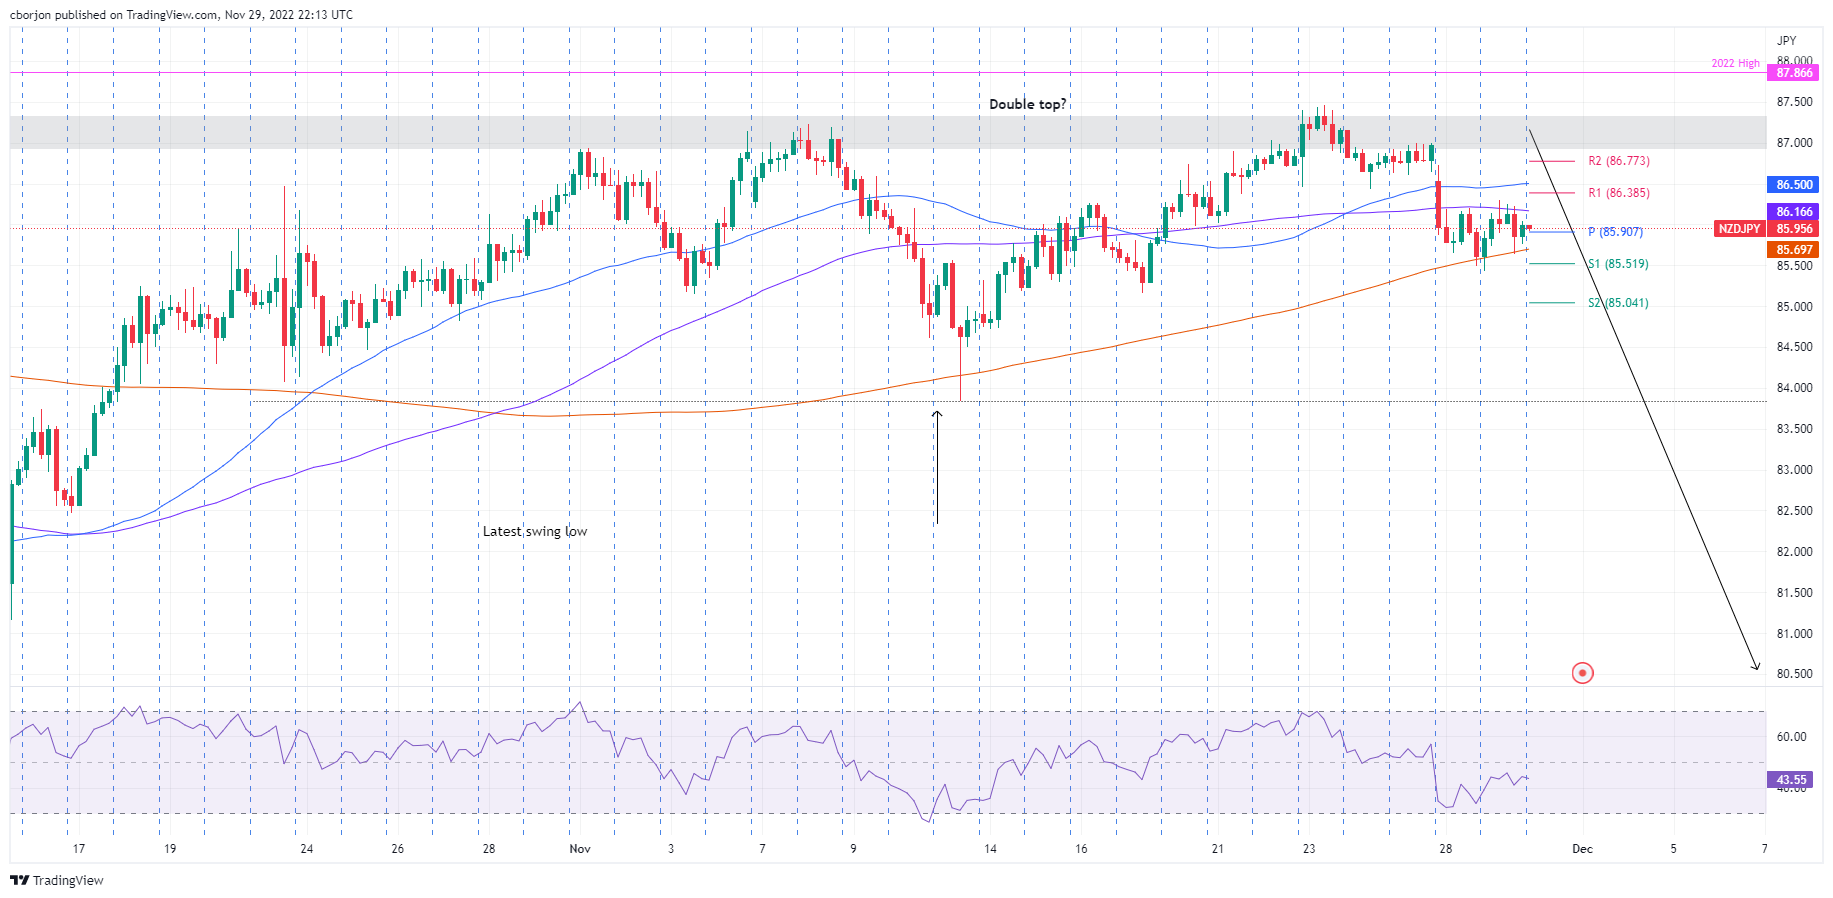
  • The double-top formation in the NZD/JPY daily chart remains in play.
  • Short term, the NZD/JPY is headed downwards, eyeing the 85.00 psychological figure.

The New Zealand Dollar (NZD) remains bid against the Japanese Yen (JPY) even though a risk-off impulse surrounds the financial market, except for the FX space, with risk-perceived currencies rising. That said, high beta currencies like the NZD are appreciating. Hence, the NZD/JPY is recovering, trading at 85.98, above its opening price by 0.42%.

NZD/JPY Price Analysis: Technical outlook

The NZD/JPY daily chart suggests a double top formation emerged of late, sparked by Monday’s plunge of more than 130 pips, driving the exchange rate towards its weekly lows of 85.42, reached on Tuesday. However, the cross-currency pair bounced toward its daily high of 86.29, and its later retracement below 86.00 could exacerbate a fall to the 200-day Exponential Moving Average (EMA) at 84.10, ahead of the November low of 83.84.

In the near term, the NZD/JPY 4-hour chart portrays the pair tested the 100-EMA around 86.17 three times before diving to the 200-EMA at 85.68. However, the NZD/JPY bounced to the daily pivot point at 85.94, shy of the 86.00 figure, which, once broken, could open the door for a re-test of the 100-EMA. But the Relative Strength Index (RSI) is in bearish territory, and possible deterioration in market mood suggests the path of least resistance is downwards.

Therefore, the NZD/JPY first support will be the 200-EMA at 85.69, which, once cleared, will send the pair diving to the S1 daily pivot at 85.52, followed by the S2 pivot at 85.04.

NZD/JPY Key Technical Levels

NZD/JPY

Overview
Today last price86.03
Today Daily Change0.45
Today Daily Change %0.53
Today daily open85.58
 
Trends
Daily SMA2086.21
Daily SMA5084.56
Daily SMA10084.9
Daily SMA20084.11
 
Levels
Previous Daily High87.05
Previous Daily Low85.5
Previous Weekly High87.46
Previous Weekly Low86.03
Previous Monthly High86.51
Previous Monthly Low80.7
Daily Fibonacci 38.2%86.09
Daily Fibonacci 61.8%86.46
Daily Pivot Point S185.04
Daily Pivot Point S284.5
Daily Pivot Point S383.49
Daily Pivot Point R186.58
Daily Pivot Point R287.58
Daily Pivot Point R388.12

Author

Christian Borjon Valencia

Markets analyst, news editor, and trading instructor with over 14 years of experience across FX, commodities, US equity indices, and global macro markets.

More from Christian Borjon Valencia
Share:

Editor's Picks

GBP/USD remains in two-day highs around 1.3260

GBP/USD adds to Friday’s bounce, gathering fresh traction and flirting with the 1.3270 zone on Monday, or two-day tops. Cable’s decent advance comes despite the move higher in the Greenback and investors’ assessing of UK PM K. Starmer's resignation.

EUR/USD remains offered; focus is on 1.1400

EUR/USD rapidly gives back Friday’s rebound and trades with marked losses near 1.1420, or three-month lows, in the latter part of Monday’s NA session. The pair’s intensifies its retracement following the continuation of the robust upside momentum in the US Dollar. Next on tap will be preliminary PMIs the Germany and the Euroland.

Gold bounces off lows, looks to surpass $4,200

Gold regains composure and leaves behind three-consecutive daily declines on Monday, looking to regain the area above the $4,200 mark per troy ounce. Reports of progress in the latest round of US-Iran talks are helping the precious metal maintain its footing at the start of the week, although the stronger Greenback seems to limit the upside potential for now.

XRP recovery underpinned by persistent ETF inflows
Ripple (XRP) gains momentum on Monday, trading above $1.15 as the crypto market widely recovers. This recovery comes amid easing geopolitical tensions in the Middle East, following reports that the United States (US) and Iran made progress in the first round of talks aimed at achieving a lasting peace agreement.
Is Shiba Inu dead or just in a crisis? The data behind SHIB's 95% crash

SHIB, the dog-themed meme coin that became one of the biggest success stories in crypto and turned early buyers into crypto millionaires, is facing tough times. Its price has fallen more than 32% so far this year, and it is down 95% from its all-time high in 2021. Is SHIB simply another fading meme coin, or is the market overlooking a possible recovery story?

Regime change: Inside Kevin Warsh's first move to make the Fed unreadable on purpose

The rate did not move. That was the least interesting thing about Kevin Warsh's first meeting in charge of the Fed. The FOMC held its benchmark at 3.50%-3.75% for the fourth straight meeting, exactly as priced, and then the new chair used his first press conference to dismantle the machinery the market has leaned on for a decade.