|

NZD/JPY Price Analysis: Sideways consolidation persists, bears to stay cautious

  • NZD/JPY gained ground on Friday's session, mildly to 89.95.
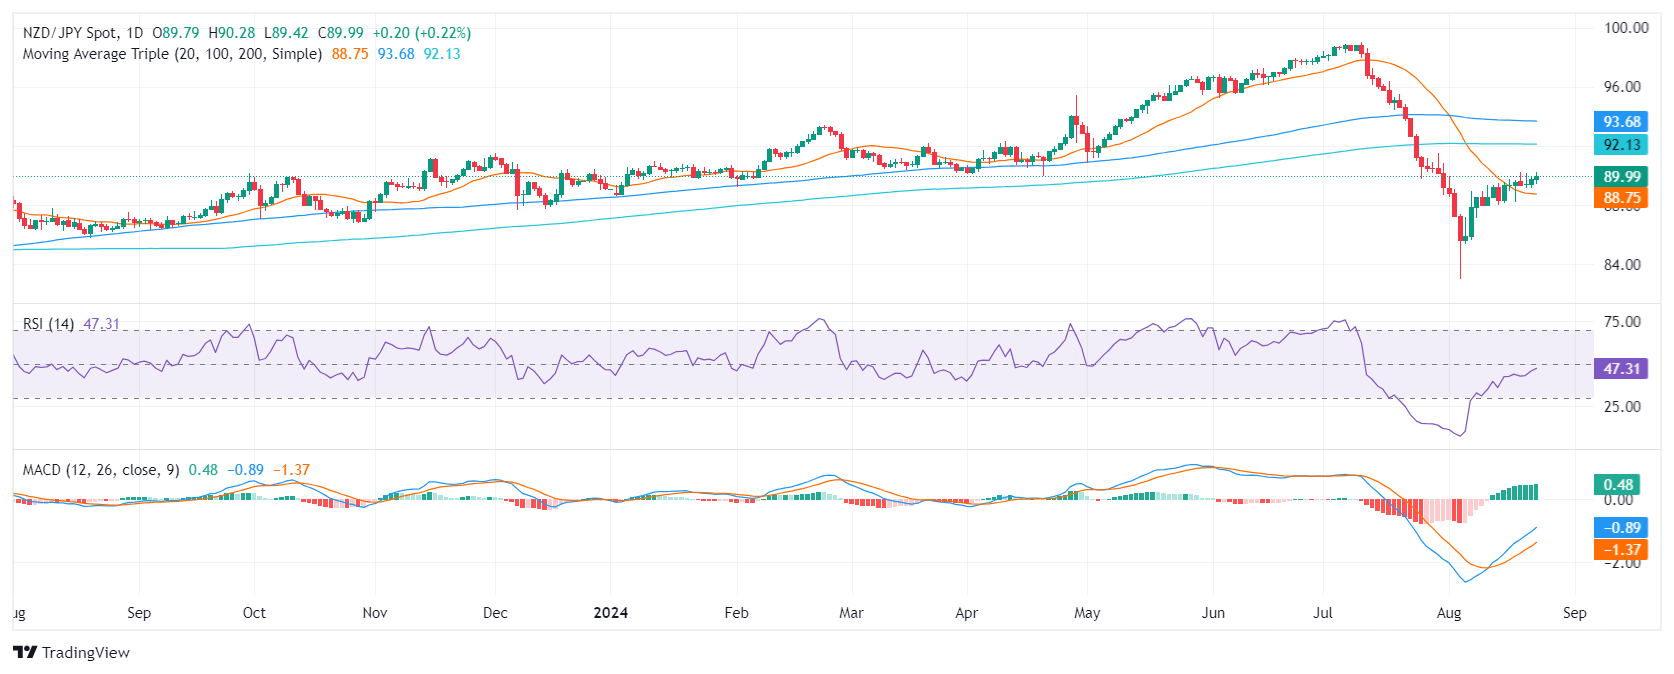
  • The RSI holds near neutral territory, indicating a balance between buying and selling forces.
  • The MACD shows flat green bars, suggesting that momentum is stabilizing.

The NZD/JPY currency pair is consolidating sideways within a familiar range below 90.00. Technical indicators display mixed signals, with the Relative Strength Index (RSI) hinting at neutral sentiment and the Moving Average Convergence Divergence (MACD) showcasing a stabilizing momentum.

The RSI, reflecting the momentum of price changes, currently sits just below 50. This reading suggests that neither buyers nor sellers have a clear advantage in the market, resulting in a balanced sentiment. Meanwhile, the MACD, a trend-following indicator, is showing flat green bars, indicating that the bullish momentum is neither gaining nor losing strength.

The pair has been hovering within a trading range defined by the 89.00 support and 90.20 resistance levels. Volume has been relatively low, indicating a lack of decisive buying or selling pressure. A break above 90.20 could signal a potential bullish continuation, opening the way towards 90.50 and 91.00. Conversely, a break below 89.00 could trigger a bearish move towards 88.50 and 88.00.

NZD/JPY daily chart

Author

Patricio Martín

Patricio is an economist from Argentina passionate about global finance and understanding the daily movements of the markets.

More from Patricio Martín
Share:

Editor's Picks

GBP/USD bounces off lows, back above 1.3200

After bottoming out near 1.3160, GBP/USD manages to regain a bit of shine and reclaim the 1.3200 mark and beyond at the end of the week. Stronger-than-expected UK Retail Sales data seem to be helping the British Pound limit its losses, while the chaotic UK political environment keeps the bulls at bay for now.

EUR/USD looks consolidative around 1.1460

EUR/USD stages a modest rebound after slipping to a three-month low below 1.1420 at the end of the week. That said, the pair now looks to consolidate humble gains just above 1.1460 despite growing uncertainty surrounding the next round of US-Iran negotiations, which keeps the US Dollar’s downside contained.

Gold slips back to six-day lows, targets $4,100

Gold retreats for the third consecutive day on Friday, eroding gains seen in the first half of the week and approaching the key $4,100 mark per troy ounce. Indeed, the precious metal continues to face headwinds from the Fed's hawkish stance and renewed uncertainty surrounding the next round of US-Iran negotiations.

Solana extends correction despite ETF inflows, RWA adoption

Solana (SOL) price edges below $70 extending its losses for the fourth straight day this week. The institutional demand for Solana is building, with steady inflows so far this week and Morgan Stanley’s amended S-1 filing for a Solana-focused Exchange-Traded Fund.

The Iran war didn't break the US economy, but what happens next?

Nearly four months after the start of the Iran war, the US economy remains remarkably resilient. While the conflict initially triggered a severe disruption to global energy markets and a sharp rise in Oil prices, recent diplomatic progress between Washington and Tehran has eased concerns about a prolonged supply shock.

Regime change: Inside Kevin Warsh's first move to make the Fed unreadable on purpose

The rate did not move. That was the least interesting thing about Kevin Warsh's first meeting in charge of the Fed. The FOMC held its benchmark at 3.50%-3.75% for the fourth straight meeting, exactly as priced, and then the new chair used his first press conference to dismantle the machinery the market has leaned on for a decade.