|

NZD/JPY Price Analysis: Cross extends gains to multi-year highs past 97.50

  • The cross continued its upward journey, reaching new cycle highs above 97.50, levels not seen since July 2007.
  • The daily chart shows intense bullish sentiment, with the Yen weakening against its peers.
  • Indicators are approaching overbought conditions which might limit the upside.

On Friday, the NZD/JPY cross extended advances and established multi-year highs above  97.50. The 20-day Simple Moving Average (SMA), now at 96.60 continued as firm support at the beginning of the week, where buyers ward off sellers' strivings to breach this level.

The daily Relative Strength Index (RSI) for NZD/JPY is currently at 68, indicating an increase from Thursday's value and overall upward momentum. Meanwhile, the Moving Average Convergence Divergence (MACD) for today shows decreasing red bars, implying decreased selling pressure. The RSI near 70 should flash caution to investors as it approaches the overbought threshold.

NZD/JPY daily chart

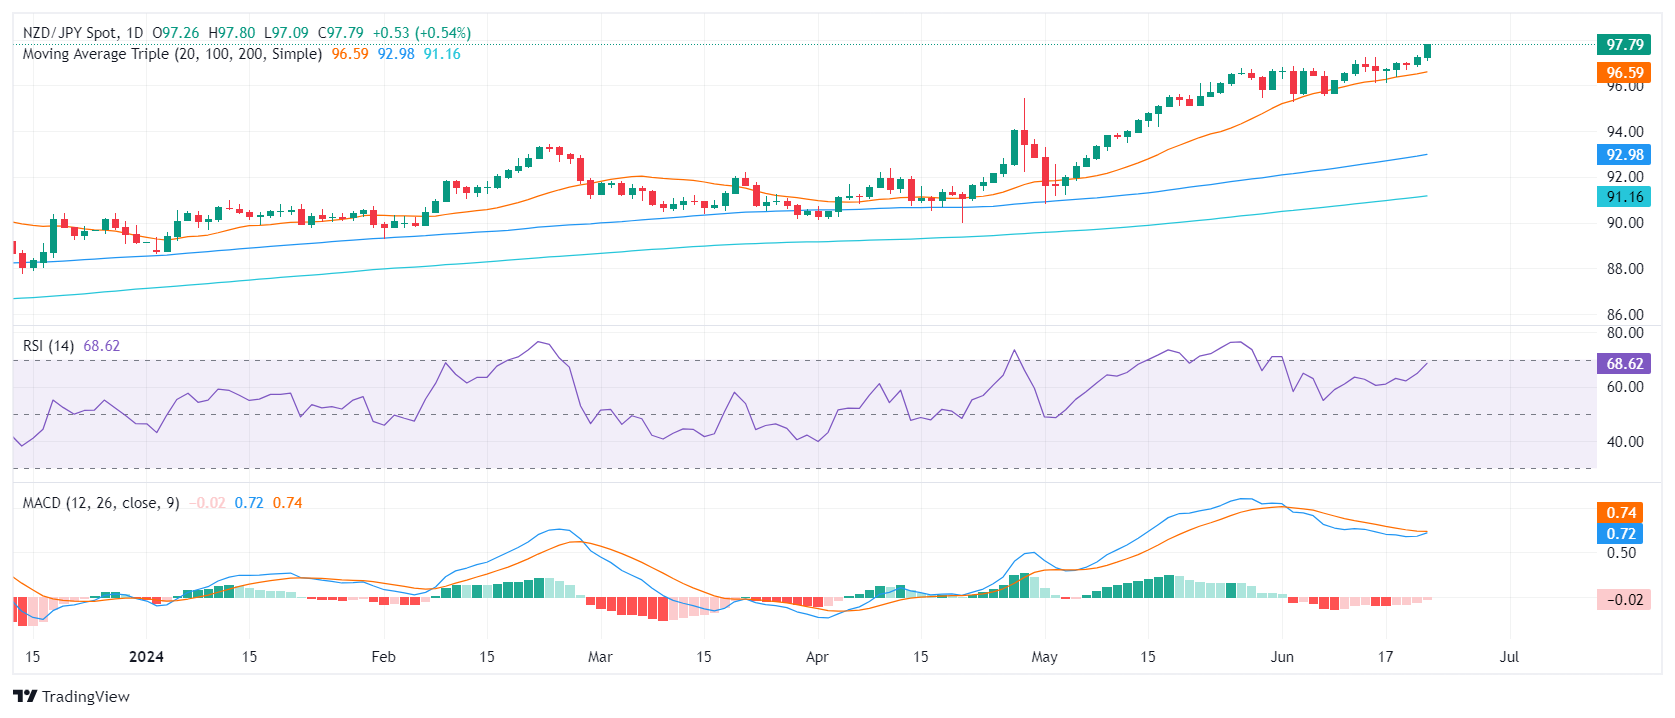
The bulls' tenacity to sustain their positions above the 20-day SMA remains unshaken. This, combined with the near-overbought daily technical indicators, reinforces the superior technical vim of the Kiwi against the Yen. The consecutive failed attempts from the sellers to breach the 96.30 point, a strong support, led to the bulls' momentum which catalyzed the surge to fresh highs.

For the following trading sessions, the cross may oscillate between the immediate support at 97.00 and the resistance target at 98.00. Investors need to keep an eye on a possible break above the mentioned range or a fall below the 20-day SMA mark which could signal a deeper correction.

NZD/JPY

Overview
Today last price97.78
Today Daily Change0.52
Today Daily Change %0.53
Today daily open97.26
 
Trends
Daily SMA2096.5
Daily SMA5094.45
Daily SMA10092.9
Daily SMA20091.11
 
Levels
Previous Daily High97.31
Previous Daily Low96.82
Previous Weekly High97.25
Previous Weekly Low95.62
Previous Monthly High96.74
Previous Monthly Low90.83
Daily Fibonacci 38.2%97.12
Daily Fibonacci 61.8%97.01
Daily Pivot Point S196.94
Daily Pivot Point S296.64
Daily Pivot Point S396.45
Daily Pivot Point R197.44
Daily Pivot Point R297.62
Daily Pivot Point R397.93

Author

Patricio Martín

Patricio is an economist from Argentina passionate about global finance and understanding the daily movements of the markets.

More from Patricio Martín
Share:

Markets move fast. We move first.

Orange Juice Newsletter brings you expert driven insights - not headlines. Every day on your inbox.

By subscribing you agree to our Terms and conditions.

Editor's Picks

EUR/USD ticks lower following the release of FOMC Minutes

The US Dollar found some near-term demand following the release of the FOMC meeting minutes, with the EUR/USD pair currently piercing the 1.1750 threshold. The document showed officials are still willing to trim interest rates. Meanwhile, thinned holiday trading keeps major pairs confined to familiar levels.

GBP/USD remains sub- 1.3500, remains in the red

The GBP/USD lost traction early in the American session, maintaining the sour tone and trading around 1.3460 following the release of the FOMC meeting minutes. Trading conditions remain thin ahead of the New Year holiday, limiting the pair's volatility.

Gold stable above $4,350 as the year comes to an end

Gold price got to recover some modest ground on Tuesday, holding on to intraday gains and changing hands at $4,360 a troy ounce in the American afternoon. The bright metal showed no reaction to the release of the FOMC December meeting minutes.

Ethereum: ETH holds above $2,900 despite rising selling activity

Ethereum (ETH) held the $2,900 level despite seeing increased selling pressure over the past week. The Exchange Netflow metric showed deposits outweighed withdrawals by about 400K ETH. The high value suggests rising selling activity amid the holiday season.

Economic outlook 2026-2027 in advanced countries: Solidity test

After a year marked by global economic resilience and ending on a note of optimism, 2026 looks promising and could be a year of solid economic performance. In our baseline scenario, we expect most of the supportive factors at work in 2025 to continue to play a role in 2026.

Crypto market outlook for 2026

Year 2025 was volatile, as crypto often is.  Among positive catalysts were favourable regulatory changes in the U.S., rise of Digital Asset Treasuries (DAT), adoption of AI and tokenization of Real-World-Assets (RWA).