|

NZD/JPY Price Analysis: Continues to plunge as sellers reign supreme

  • Friday's trading session saw the NZD/JPY pair resuming its losses, exacerbating the bearish momentum.
  • Cross ends the week with a near 2% loss.
  • Sellers are pointing towards the 100-day SMA.

In Friday's trading session, the NZD/JPY pair extended its losses and slumped to 94.65, marking a 0.50% decline. Even though a slight rebound occurred on Thursday, the pair ended the week with approximately 2% losses, underscoring a continuously negative outlook.

Daily technical indicators reinforce the control of the bears, irrespective of Thursday's brief rebound. The Relative Strength Index (RSI) edged into oversold territory while the Moving Average Convergence Divergence (MACD) continued to print rising red bars, implying the presence of sustained selling pressure. However, the RSI below 30, might suggest an incoming upwards correction.

NZD/JPY daily chart

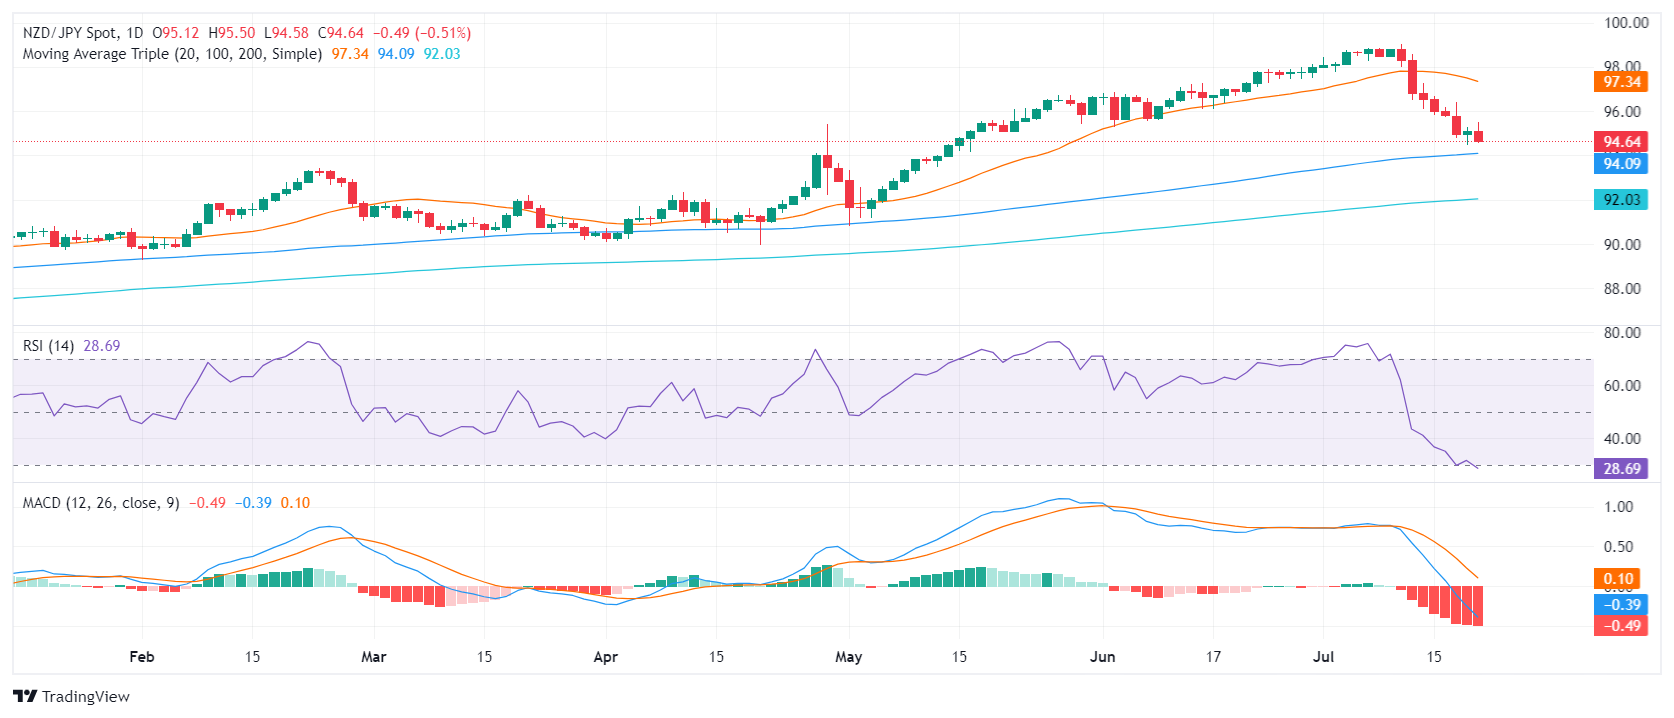
Corresponding to the established bearish mood, immediate support levels are now lower at 94.50 and at the 100-day Simple Moving Average (SMA) of 94.00. A downward crossing of these levels could substantiate the short-term bearish superiority. Resistance levels stay at the prior support markers of 95.00, 95.50, and 96.00, which could be significant thresholds for possible upside movements.

Author

Patricio Martín

Patricio is an economist from Argentina passionate about global finance and understanding the daily movements of the markets.

More from Patricio Martín
Share:

Editor's Picks

GBP/USD loses momentum, flirts with 1.3200

GBP/USD is struggling to maintain its positive bias on Thursday, retreating toward the 1.3200 region in response to the pick in the buying interest around the Greenback. That said, Cable remains under scrutiny as cautious market sentiment keeps investors focused on the US-Iran conflict and political effervescence in the UK.

EUR/USD trims gains, challenges 1.1400

EUR/USD now gives away part of its earlier advance, receding toward the 1.1400 contention zone on Thursday. Meanwhile, the pair’s recovery comes amid extra losses in the US Dollar, at the time when while investors continue to monitor developments in the Middle East and sentiment surrounding global technology stocks.

Gold remains bid and close to $4,100

Gold accelerates its recovery and approaches the key $4,000 mark per troy ounce at the end of the week, adding to Thursday’s advance. However, expectations for a hawkish Fed remain steady and keep the yellow metal’s potential upside contained.

Crypto Today: Bitcoin at $60,000, Ethereum at $1,500, and XRP at $1 face a make-or-break test

Bitcoin (BTC), Ethereum (ETH), and Ripple (XRP) are trading in the red on Friday after three consecutive days of losses, testing their respective make-or-break support levels.

Week ahead – NFP report to challenge Dollar strength and the hawkish Fed

Dollar strength dominates markets, as the hawkish Fed overshadows geopolitics and lower oil prices. NFP week could drive September Fed hike expectations and boost market volatility. The euro lacks fresh bullish catalysts, all eyes on the preliminary inflation report and the ECB Forum.

Regime change: Inside Kevin Warsh's first move to make the Fed unreadable on purpose

The rate did not move. That was the least interesting thing about Kevin Warsh's first meeting in charge of the Fed. The FOMC held its benchmark at 3.50%-3.75% for the fourth straight meeting, exactly as priced, and then the new chair used his first press conference to dismantle the machinery the market has leaned on for a decade.