|

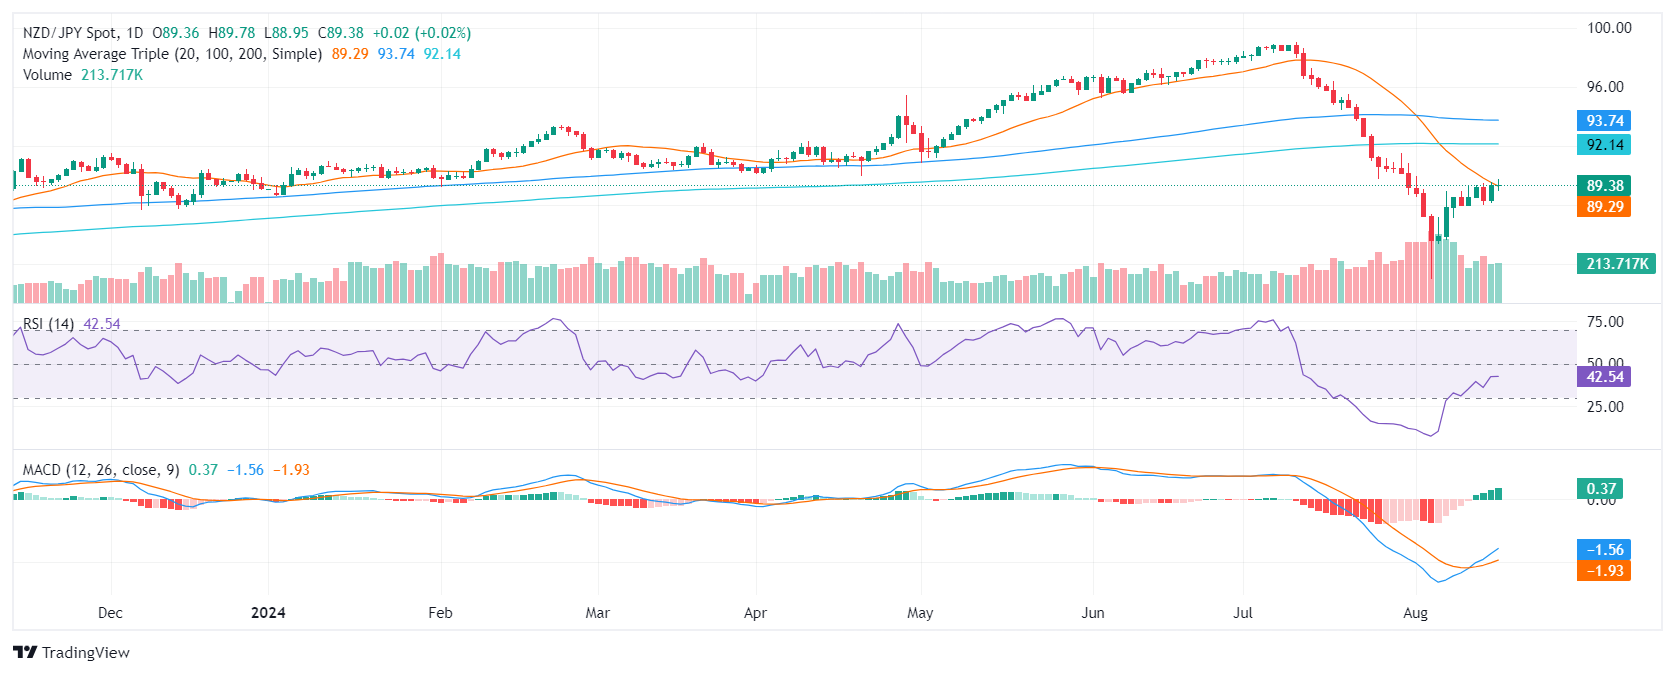
NZD/JPY Price Analysis: Bulls regain some ground, must conquer the 20-day SMA

  • NZD/JPY mildly rose to 89.30, testing the 20-day SMA.
  • The RSI is near 50 while the MACD shows flat green bars, signaling that the momentum is sideways.
  • A jump above the 20-day SMA would confirm a bullish outlook.

The NZD/JPY pair gained ground in Friday's session, climbing to 89.30. The uptick follows side-ways movements during the week, but the pair could be ready for a change of trend.

The Relative Strength Index (RSI) is hovering near 50, indicating that the pair is near neutral territory. If the RSI can move above 50, it could signal a potential shift in market sentiment. The Moving Average Convergence Divergence (MACD) shows flat green bars, indicating that the momentum is sideways. The positive divergence between the RSI and MACD shows that the selling pressure is being pressured by the buying force and it is possible that, if this holds, the pair can see upside movements in the next sessions.

The NZD/JPY pair has bounced off the support level of 88.50 and is currently challenging the 20-day SMA. If the pair continues to rise, it could find resistance at 0.8970 and 0.9000. On the downside, support can be found at 0.8900, 0.8880, and 0.8840. A sustained break above 0.8970 could signal a continuation of the uptrend, while a break below 0.8840 could signal a continuation of the downtrend. The volume has been declining during the last few sessions, which is a sign of neutrality.

NZD/JPY daily chart

Author

Patricio Martín

Patricio is an economist from Argentina passionate about global finance and understanding the daily movements of the markets.

More from Patricio Martín
Share:

Markets move fast. We move first.

Orange Juice Newsletter brings you expert driven insights - not headlines. Every day on your inbox.

By subscribing you agree to our Terms and conditions.

Editor's Picks

EUR/USD holds steady below 1.1800

EUR/USD moves sideways in a narrow channel below 1.1800 as the market volatility remains low ahead of the New Year holiday. On Tuesday, investors will pay close attention to the minutes of the Federal Reserve's December policy meeting.

GBP/USD retreats below 1.3500 as trading conditions remain thin

GBP/USD corrects lower after posting strong gains in the previous week and trades below 1.3500 on Monday. With the action in financial markets turning subdued following the Christmas holiday, however, the pair's losses remain limited.

Gold holds above $4,300 after profit taking kicked in

Gold retreats sharply from the record-peak it set at $4,550 and trades below $4,400, losing more than 3% on the day. Growing optimism about a Ukraine-Russia peace agreement and profit-taking ahead of the New Year holiday seem to be causing XAU/USD to stay under heavy bearish pressure.

Bitcoin, Ethereum, and XRP bulls regain strength

Bitcoin, Ethereum, and Ripple record roughly 3% gains on Monday, regaining strength mid-holiday season. Despite thin liquidity in the holiday season, BTC and major altcoins are regaining strength as US President Donald Trump pushes peace talks between Russia and Ukraine. The technical outlook for Bitcoin, Ethereum, and Ripple gradually shifts bullish as selling pressure wanes.

Economic outlook 2026-2027 in advanced countries: Solidity test

After a year marked by global economic resilience and ending on a note of optimism, 2026 looks promising and could be a year of solid economic performance. In our baseline scenario, we expect most of the supportive factors at work in 2025 to continue to play a role in 2026.

Crypto market outlook for 2026

Year 2025 was volatile, as crypto often is.  Among positive catalysts were favourable regulatory changes in the U.S., rise of Digital Asset Treasuries (DAT), adoption of AI and tokenization of Real-World-Assets (RWA).