|

NZD/JPY Price Analysis: Bears maintain grip and further descend beneath 200-day SMA

  • Monday's trading session saw a mild downward deviation in the NZD/JPY.
  • Losses materialized in thirteen of the past fourteen sessions, pointing to an intensifying bearish tendency.
  • Sellers retain the upper hand, having plummeted beyond the pivotal 200-day SMA.

In Monday's trading session, the NZD/JPY pair slightly declined and dropped to 90.50, marking a continuation of the downward trend. The pair has witnessed losses in thirteen out of the last fourteen sessions, strengthening the bearish trend substantially. Since the beginning of July, the cross has now plunged by over 7%, positioning itself significantly below the vital 200-day Simple Moving Average (SMA).

Despite this seemingly relentless journey south, daily technical indicators deep in oversold territory suggest a potential for a looming side-ways trading period. The Relative Strength Index (RSI) is now at 14, sinking further into oversold territory. Moreover, the Moving Average Convergence Divergence (MACD) continues to print decreasing red bars, indicating that the selling pressure is easing off.

NZD/JPY daily chart

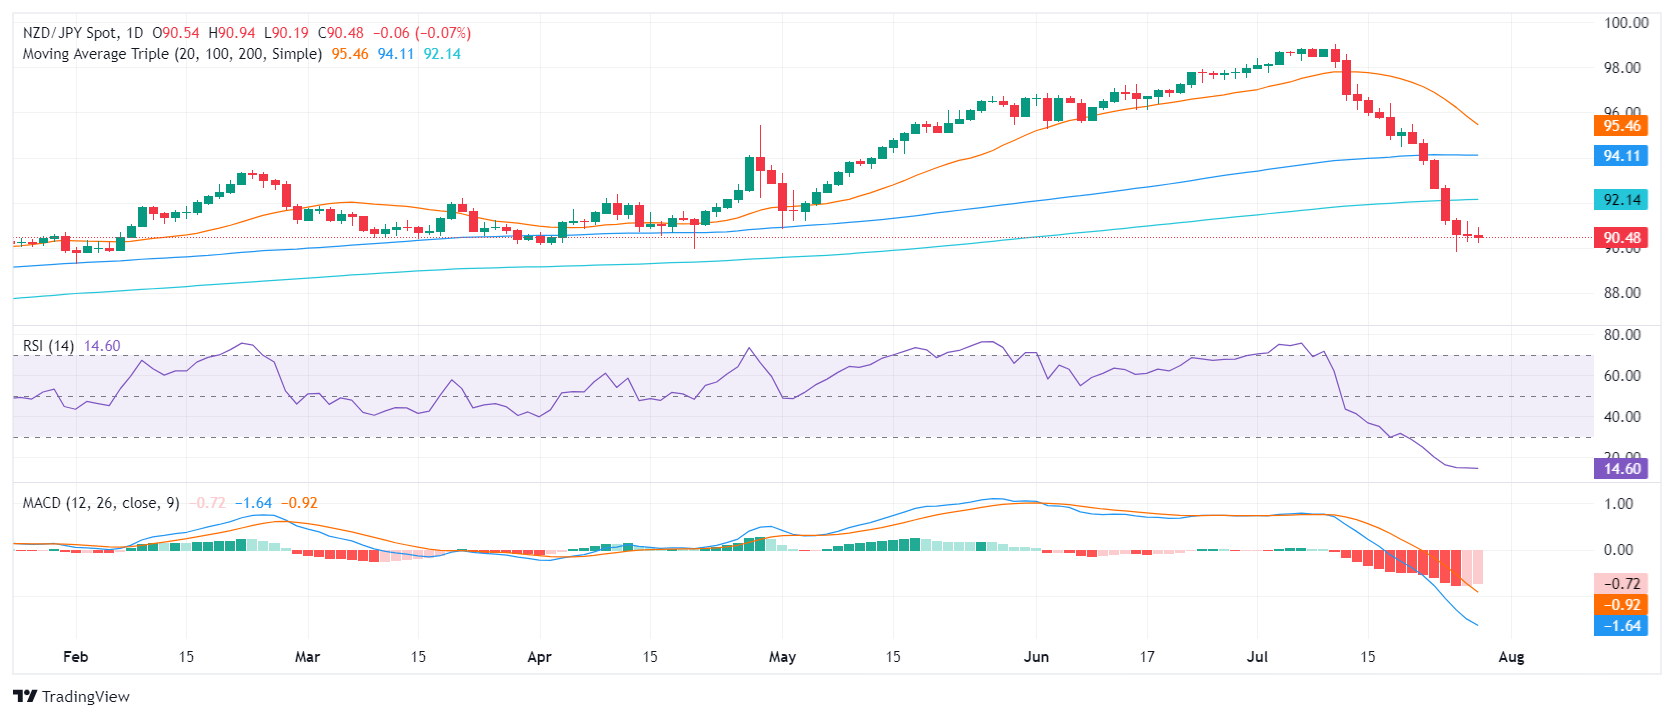
With the pair now below 91.00, bulls will need to defend levels at 90.50, 90.30, and 90.00 to prevent further losses. On the other hand, resistance levels reside at the previous points of 92.15 (200-day SMA), 92.50, and 94.20 (100-day SMA).

Author

Patricio Martín

Patricio is an economist from Argentina passionate about global finance and understanding the daily movements of the markets.

More from Patricio Martín
Share:

Markets move fast. We move first.

Orange Juice Newsletter brings you expert driven insights - not headlines. Every day on your inbox.

By subscribing you agree to our Terms and conditions.

Editor's Picks

EUR/USD trims losses and returns to the 1.1750 area

The US Dollar resumed its decline in the American afternoon, helping EUR/USD trim early losses. The pair trades around 1.1750 as market participants gear up for the European Central Bank monetary policy decision and the United States Consumer Price Index.

GBP/USD consolidates above mid-1.3300s as traders await BoE and US CPI report

The GBP/USD pair struggles to capitalize on the overnight bounce from the 1.3310 area, or a one-week low, and oscillates in a narrow band during the Asian session on Thursday. Spot prices currently trade around the 1.3370 region, down less than 0.10% for the day, as traders opt to wait on the sidelines ahead of the key central bank event risk and US consumer inflation data.

Gold declines on profit-taking, USD strength ahead of US CPI release

Gold price edges lower below $4,350 during the Asian trading hours on Thursday. The precious metal retreats from seven-week highs amid some profit-taking and a rebound in the US Dollar (USD). The potential downside for the yellow metal might be limited after the recent US jobs data reinforce market expectations of further interest rate cuts by the US Federal Reserve and drag the USD lower. 

Top Crypto Losers: Pump.fun, SPX6900, Bittensor slide further with double-digit losses

Pump.fun, SPX6900, and Bittensor are leading the losses in the cryptocurrency market over the last 24 hours amid total liquidations of over $500 million. The retail segment alleges institutional manipulation amid an early-morning Bitcoin sell-off routine in the US market.

Monetary policy: Three central banks, three decisions, the same caution

While the Fed eased its monetary policy on 10 December for the third consecutive FOMC meeting, without making any guarantees about future action, the BoE, the ECB and the BoJ are holding their respective meetings this week. 

Crypto Today: Bitcoin, Ethereum, XRP slide further as risk-off sentiment deepens

Bitcoin faces extended pressure as institutional investors reduce their risk exposure. Ethereum’s upside capped at $3,000, weighed down by ETF outflows and bearish signals. XRP slides toward November’s support at $1.82 despite mild ETF inflows.