Nvidia stock surges and crashes as bulls, bears fight over meaning of Q3 results


  • Nvidia stock has traded violently on Thursday.
  • The semiconductor designer known for its AI GPUs beat Q3 consensus.
  • Q4 revenue guidance may have been too ho-hum for some.
  • Adjusted gross margin expected to condense in Q4.
     

Nvidia (NVDA) stock surged to an all-time high of $152.89, up 4.8% in the first two minutes of trading on Thursday following the leading semiconductor designer’s third-quarter results that were released in Wednesday’s post-market.

Then just as quickly, Nvidia shares sank more than 1% to below $144 as the minutes ticked by. It would seem that there is widespread disagreement over the meaning of the recent quarter’s results.

Nvidia has continued by all accounts to dominate the artificial intelligence (AI) industry with its Hopper and Blackwell GPUs used to train large language models and deal with the new generative AI landscape.

The Dow Jones has gained 0.35% in the meantime as US Initial Jobless Claims for the previous week arrived below consensus, showing that the US economy might be in better shape than originally thought.

Nvidia earnings review

Nvidia managed to beat both the top and bottom line consensus expectations for Q3. Adjusted earnings of $0.81 per share easily beat Wall Street predictions for $0.74. Revenue of $35.08 billion also topped consensus of $33.25 billion.

“AI is transforming every industry, company and country," said CEO and founder Jensen Huang in a statement. "Enterprises are adopting agentic AI to revolutionize workflows. Industrial robotics investments are surging with breakthroughs in physical AI. And countries have awakened to the importance of developing their national AI and infrastructure."

The friction really comes from management’s projection of $37.5 billion in revenue for the fourth quarter. The average consensus for Q4 was already $37.1 billion, so the guidance strikes many as good. 

However, the market has come to expect outsized guidance from the king of chips, and some analysts are projecting revenue of $41 billion. This makes the $37.5 billion figure relatively less impressive.

Data revenue continues to crowd out all other facets of the company. The segment delivered $30.8 billion in sales during Q3, which was up 112% YoY and 17% higher than one quarter earlier. 

Gaming revenue gained 15% YoY to $3.3 billion, while Professional Visualization accounted for $486 million in sales, up 17%.

Nvidia posted a mouth-watering 75% adjusted gross margin for Q3 but guided for 73.5% in Q4.

Nvidia stock forecast

Nvidia stock has reached nearly to $153 on Thursday but now trades in the $143 before lunchtime. The hourly chart below shows support at $140.76, which was the June 20 range high. Additionally, further support sits nearby at $138.

A break of $138 would likely influence traders to dump NVDA shares, and then the $132.50 support level from late October would come into view. But any break above $150 would mean the bearishness is over. 

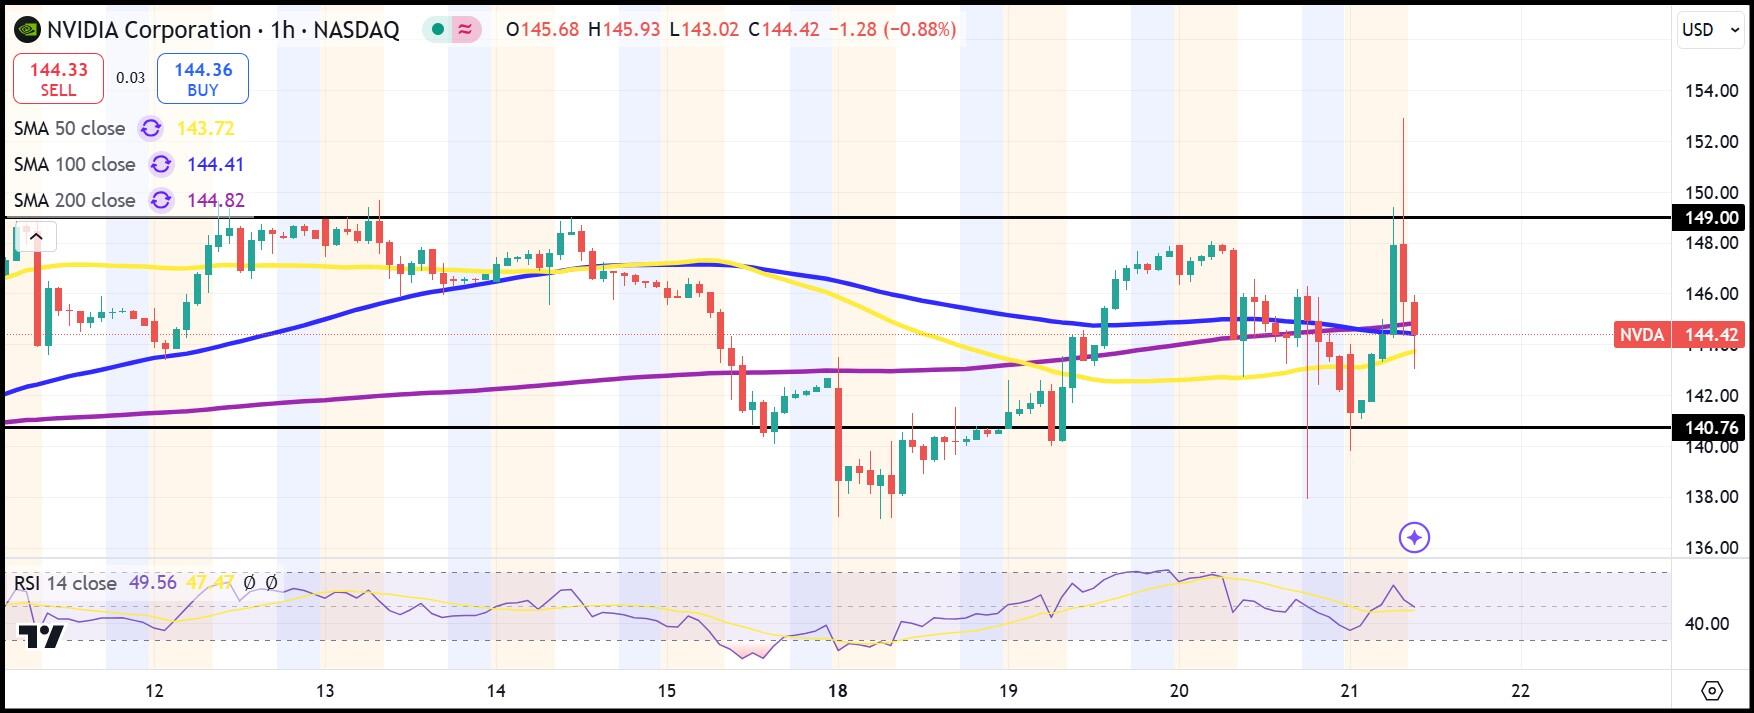
NVDA 1-hour stock chart


Share: Feed news

Information on these pages contains forward-looking statements that involve risks and uncertainties. Markets and instruments profiled on this page are for informational purposes only and should not in any way come across as a recommendation to buy or sell in these assets. You should do your own thorough research before making any investment decisions. FXStreet does not in any way guarantee that this information is free from mistakes, errors, or material misstatements. It also does not guarantee that this information is of a timely nature. Investing in Open Markets involves a great deal of risk, including the loss of all or a portion of your investment, as well as emotional distress. All risks, losses and costs associated with investing, including total loss of principal, are your responsibility. The views and opinions expressed in this article are those of the authors and do not necessarily reflect the official policy or position of FXStreet nor its advertisers. The author will not be held responsible for information that is found at the end of links posted on this page.

If not otherwise explicitly mentioned in the body of the article, at the time of writing, the author has no position in any stock mentioned in this article and no business relationship with any company mentioned. The author has not received compensation for writing this article, other than from FXStreet.

FXStreet and the author do not provide personalized recommendations. The author makes no representations as to the accuracy, completeness, or suitability of this information. FXStreet and the author will not be liable for any errors, omissions or any losses, injuries or damages arising from this information and its display or use. Errors and omissions excepted.

The author and FXStreet are not registered investment advisors and nothing in this article is intended to be investment advice.

Recommended content


Recommended content

Editors’ Picks

AUD/USD: Formidable resistance sits above 0.6500

AUD/USD: Formidable resistance sits above 0.6500

AUD/USD reversed part of Tuesday’s pronounced recovery, coming under renewed downside pressure on the back of the late rebound in the US Dollar. The move higher in the Greenback was propped up by prospects of further progress on the trad front, while speculation kept pointing to a later-than-expected Fed rate cuts.

EUR/USD: Another drop to 1.1060 is not ruled out

EUR/USD: Another drop to 1.1060 is not ruled out

EUR/USD rapidly faded its initial move to weekly highs around the 1.1270 zone on Wednesday, refocusing on the downside and approaching the 1.1160 region toward the closing bell on Wall Street. The pair’s pullback came on the back of the firm tone in the Greenback, which managed to regain balance and reverse initial losses, all ahead of Thursday’s release of US Retail Sales and the speech by the Fed’s Powell.

Gold looks consolidative below 3,200

Gold looks consolidative below 3,200

Gold appears to have entered a brief consolidation phase below the $3,200 mark per troy ounce on Wednesday, following an earlier drop to five-week lows. The retreat came as investors continued to rotate out of the safe-haven asset, with growing optimism over trade developments driving steady selling in the metal.

$100M DeFi Development funding sends Solana price above 73-day resistance

$100M DeFi Development funding sends Solana price above 73-day resistance

Solana price surged past $184 on Wednesday, marking a 25% gain in May. The rally follows a fresh capital injection by DeFi Development, reaffirming institutional confidence in Solana’s blockchain ecosystem amid favorable macroeconomic signals. 

US-China trade truce only emphasizes timeless investing truths

US-China trade truce only emphasizes timeless investing truths

Markets roared back to life as the US and China hit pause on their escalating trade war, with both sides emphasizing mutual respect and dignity. But it wasn’t the fine print that moved markets—it was the mood shift. Investors rushed back into risk assets, betting that the worst might be behind us.

The Best brokers to trade EUR/USD

The Best brokers to trade EUR/USD

SPONSORED Discover the top brokers for trading EUR/USD in 2025. Our list features brokers with competitive spreads, fast execution, and powerful platforms. Whether you're a beginner or an expert, find the right partner to navigate the dynamic Forex market.

Forex MAJORS

Cryptocurrencies

Signatures

Best Brokers of 2025