Nvidia Stock Price and Forecast: NVDA caught in tug-of-war at $200 on heavy volume
- NVDA stock has been hurt this week by Netflix earnings.
- Netflix subscriber losses have pushed the market to abandon many other growth names.
- Federal Reserve chairman Jay Powell contemplates faster rate hikes.

UPDATE: Nvidia shares road a wave of higher-than-normal volume on Friday morning at the open as bulls pushed the semiconductor above $204 before it slid as low as $197.28 about 12 minutes into the session. Volume at the open ranks as one of the highest opening levels for Nvidia all year. The $200 level is key as a large psychological number. Bulls want it to bounce off this level, but bears are persuaded that Nvidia stock dropping below support at $206.50 on Thursday was the key to a broader move lower. Falling below $200 is then in the cards.
Other growth stocks are also selling off as the Nasdaq Composite sheds 0.8% at about 10:45 AM in New York. At the time of writing, bulls are manning the barricades quite well. NVDA stock is up 0.5% at $202.76. On the 5-minute chart below, it is easy to see that a symmetrical wedge has formed for Friday's session. The apex sits at $201.88, which bodes well for the bulls, at least for now. Dropping below the lower line should lead to a steeper fall off before the close. Likewise, climbing above the top line should engender a positive move as well.

NVDA April 22, 2022 15-minute chart
Nvidia stock (NVDA) collapsed more than 6% on Thursday and lost further ground afterhours. In doing so, NVDA shares broke through an important support at $206.50 that implies a further drop below $200. Shares dropped to $201.83 at market close on Thursday before shedding another half percentage point to $200.90. The psychologically significant $200 level seems doomed to fail fairly soon.
Nvidia Stock Price: Netflix read-across, agressive Fed lead to worries
The now infamous Netflix Q1 earnings call handed the streaming leader its first subscriber drop-off in 10 years. Yes, it would not have lost subscribers if not for the 700,000 abandoned accounts that were a casualty of the Russia-Ukraine War, but Netflix would have still only gained about 500,000 during the quarter without that added surprise. Half a million was still much less than the 2 million it guided for last earnings call. More than 600,000 accounts were abandoned in the US and Canada alone during Q1 as well.
Netflix preceded to lose 35% in the following session. As Netflix has spent the past 15-odd years as the quintessential growth stock, the news of its demise and/or fall from grace has affected the entire sector. With Facebook falling off a cliff to start the year and now Netflix, investors are reassessing all their high-mulitple growth stocks. Docusign (DOCU), Roku (ROKU) and Shopify (SHOP) have all suffered related falls this week in light of Netflix. Nvidia as a major member of this group has been treated the same.
Second, news from the Federal Reserve has emerged this week that interest rates may increase at a faster pace in a bid to deal resolutely with stubbornly high inflation. Japenese investment bank Nomura now predicts a 50 basis point interest rate hike in May, followed by two 75 basis point jumps in June and July. This would amount to one of the fastest hiking cycles in the Fed's history and could engender a more severe sell-off in growth stocks, which typically do better during low interest rate environments.
Lastly, Deutsche Bank reduced its price target on NVDA shares from $285 to $255. This still gives Nvidia stock 25% upside at current prices, but it is in line with other Wall Street firms that have reduced their bullish fervor for Nvidia.
Nvidia Stock Forecast: Breaking $206.50 is a warning
Any trader should see NVDA stock breaking through $206.50 on Thursday as a clear bearish sign. If you have not already, it is time to sell. The support level from $206.50 to $208.95 has held strong on three separate occasions since the start of the year. Even $210 has worked as solid support for most of the year. At $200 then, Nvidia looks quite weak, though the big round rumber may hold up if investors are lucky. Shares have not traded here since the beginning of October 2021.
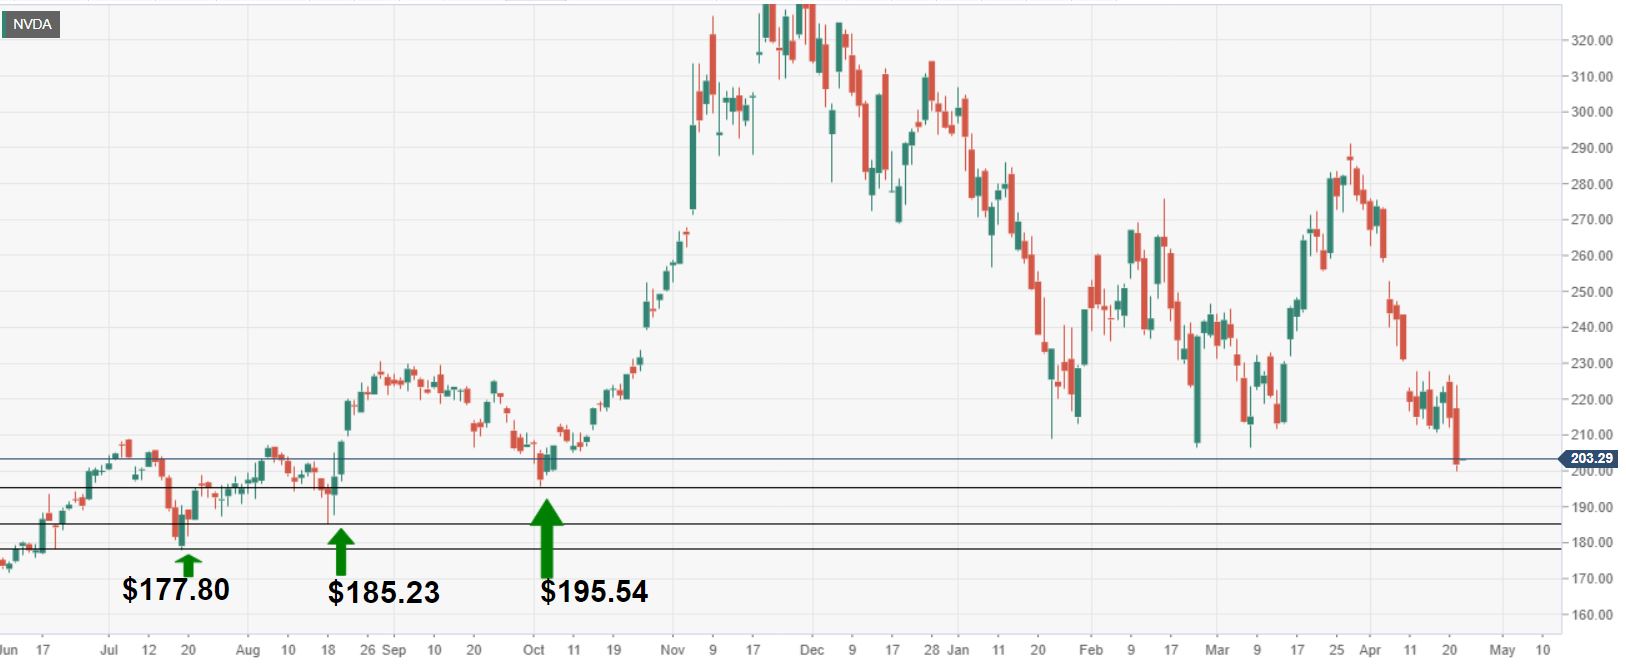
More likely is that Nvidia will melt down to one of the three support levels that have been indicated on the daily chart below. These are $195.54 from last October, $185.23 from last August and $177.80 from July 2021. Any one of these may hold up in a sell-off, but from this vantage point it is difficult to know which one.
If there is a turnaround and Nvidia stock remains above $200, then it quickly needs to regain $206.50 to remain neutral. NVDA would then need to rally above the 21-day moving average, which currently sits at $217.39 (as can be seen on the weekly chart). The 200-day moving average above $244 is out of the question for now, but that level would prove a bull trend.
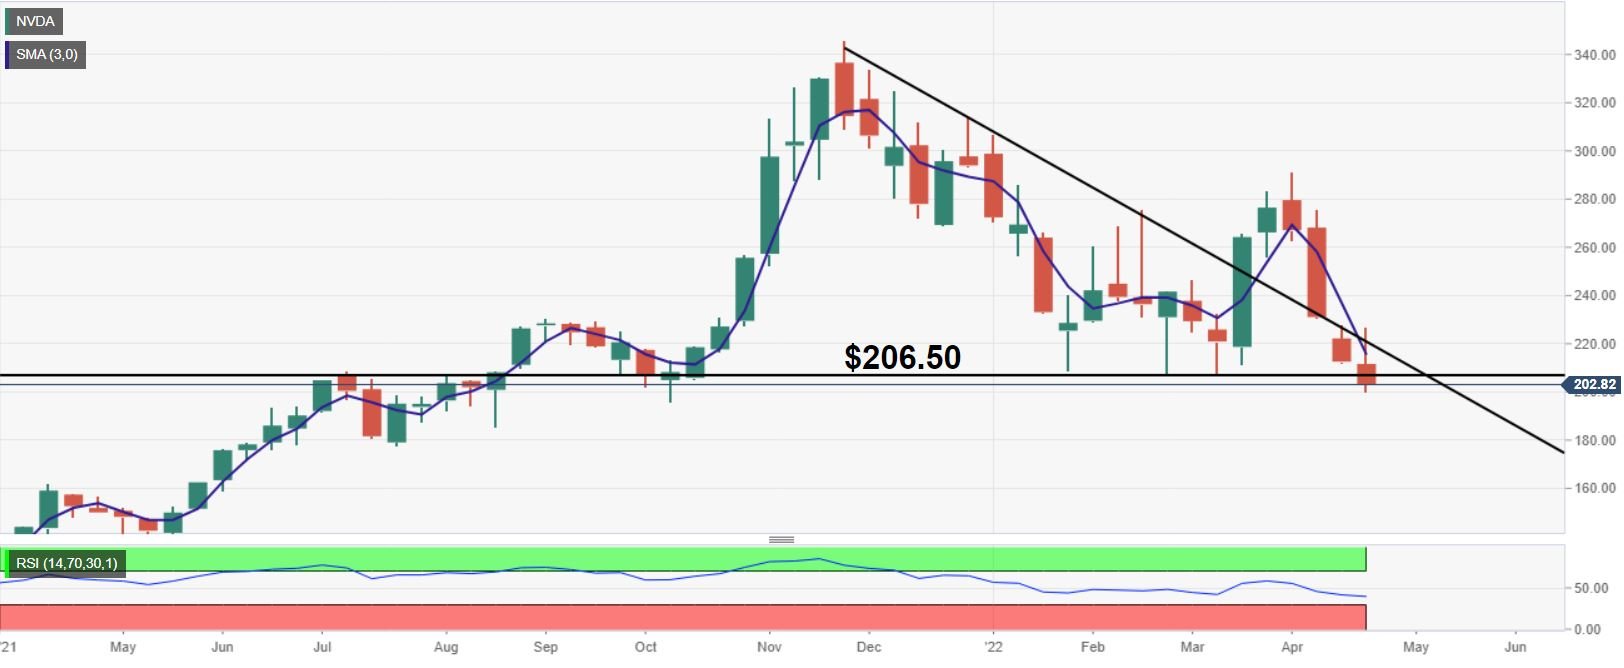
NVDA 1-day chart
As another way of showing $206.50's importance, just look at the falling wedge scenario the semiconductor has been trading within since December. NVDA shares were able to climb out of the wedge in March but quickly fell back in and then through the bottom support level at $206.50 on Thursday. This action has turned what would have been a bullish sign into a demonstrably bearish signal. The Relative Strength Index (RSI) at 40 proves that the market can stomach another leg down for Nvidia shares at its present location. It may not be oversold until the $180s.
Premium
You have reached your limit of 3 free articles for this month.
Start your subscription and get access to all our original articles.
Author

Clay Webster
FXStreet
Clay Webster grew up in the US outside Buffalo, New York and Lancaster, Pennsylvania. He began investing after college following the 2008 financial crisis.


