Nvidia Stock Price and Forecast: NVDA bounces off key support at $313
- Nvidia stock stages a perfect recovery on Wednesday.
- NVDA stock closes ahead of Thanksgiving up 3%.
- NVDA is just below record highs after a strong earnings report.

Nvidia (NVDA) stock returned to near all-time highs with a 3% gain on Wednesday. The stock had fallen slightly from the impressive all-time highs set in motion from the strong earnings last week.
-637734334456884559.png)
Nvidia (NVDA) graph, 15-minute
Nvidia (NVDA) stock news
The situation over Nvidia's bid for UK chipmaker ARM is still ongoing. The chipmaker is actually owned by Softbank of Japan, but the UK government does have national security concerns over the proposed deal and is investigating the matter. The proposed deal is also seeing EU and US authorities scrutinize the deal. UK Competition and Markets Authority (CMA) CEO Andrea Coscelli was reported by Bloomberg as saying that the proposed deal between Nvidia and ARM was leading to weekly talks between the UK and the Federal Trade Commission (FTC) in the US. An earlier report in The Daily Mail had seen UK ministers doubt the deal would get the go-ahead.
However, the stock remains poised to make fresh record highs after recovering some ground on Wednesday. The stock has been overly strong this year with semiconductors in short supply and Nvidia also benefitting from games growth and growth potential from its omniverse pivot. In fact, figures from Global Data shows that mentions of "metaverse" were up 135% in the last quarter's earnings transcripts (Reuters). As Facebook (FB) changed its name to Meta Platforms, Nvidia seems positioned well to benefit from this growing concept and potential revenue stream.
Nvidia (NVDA) stock forecast
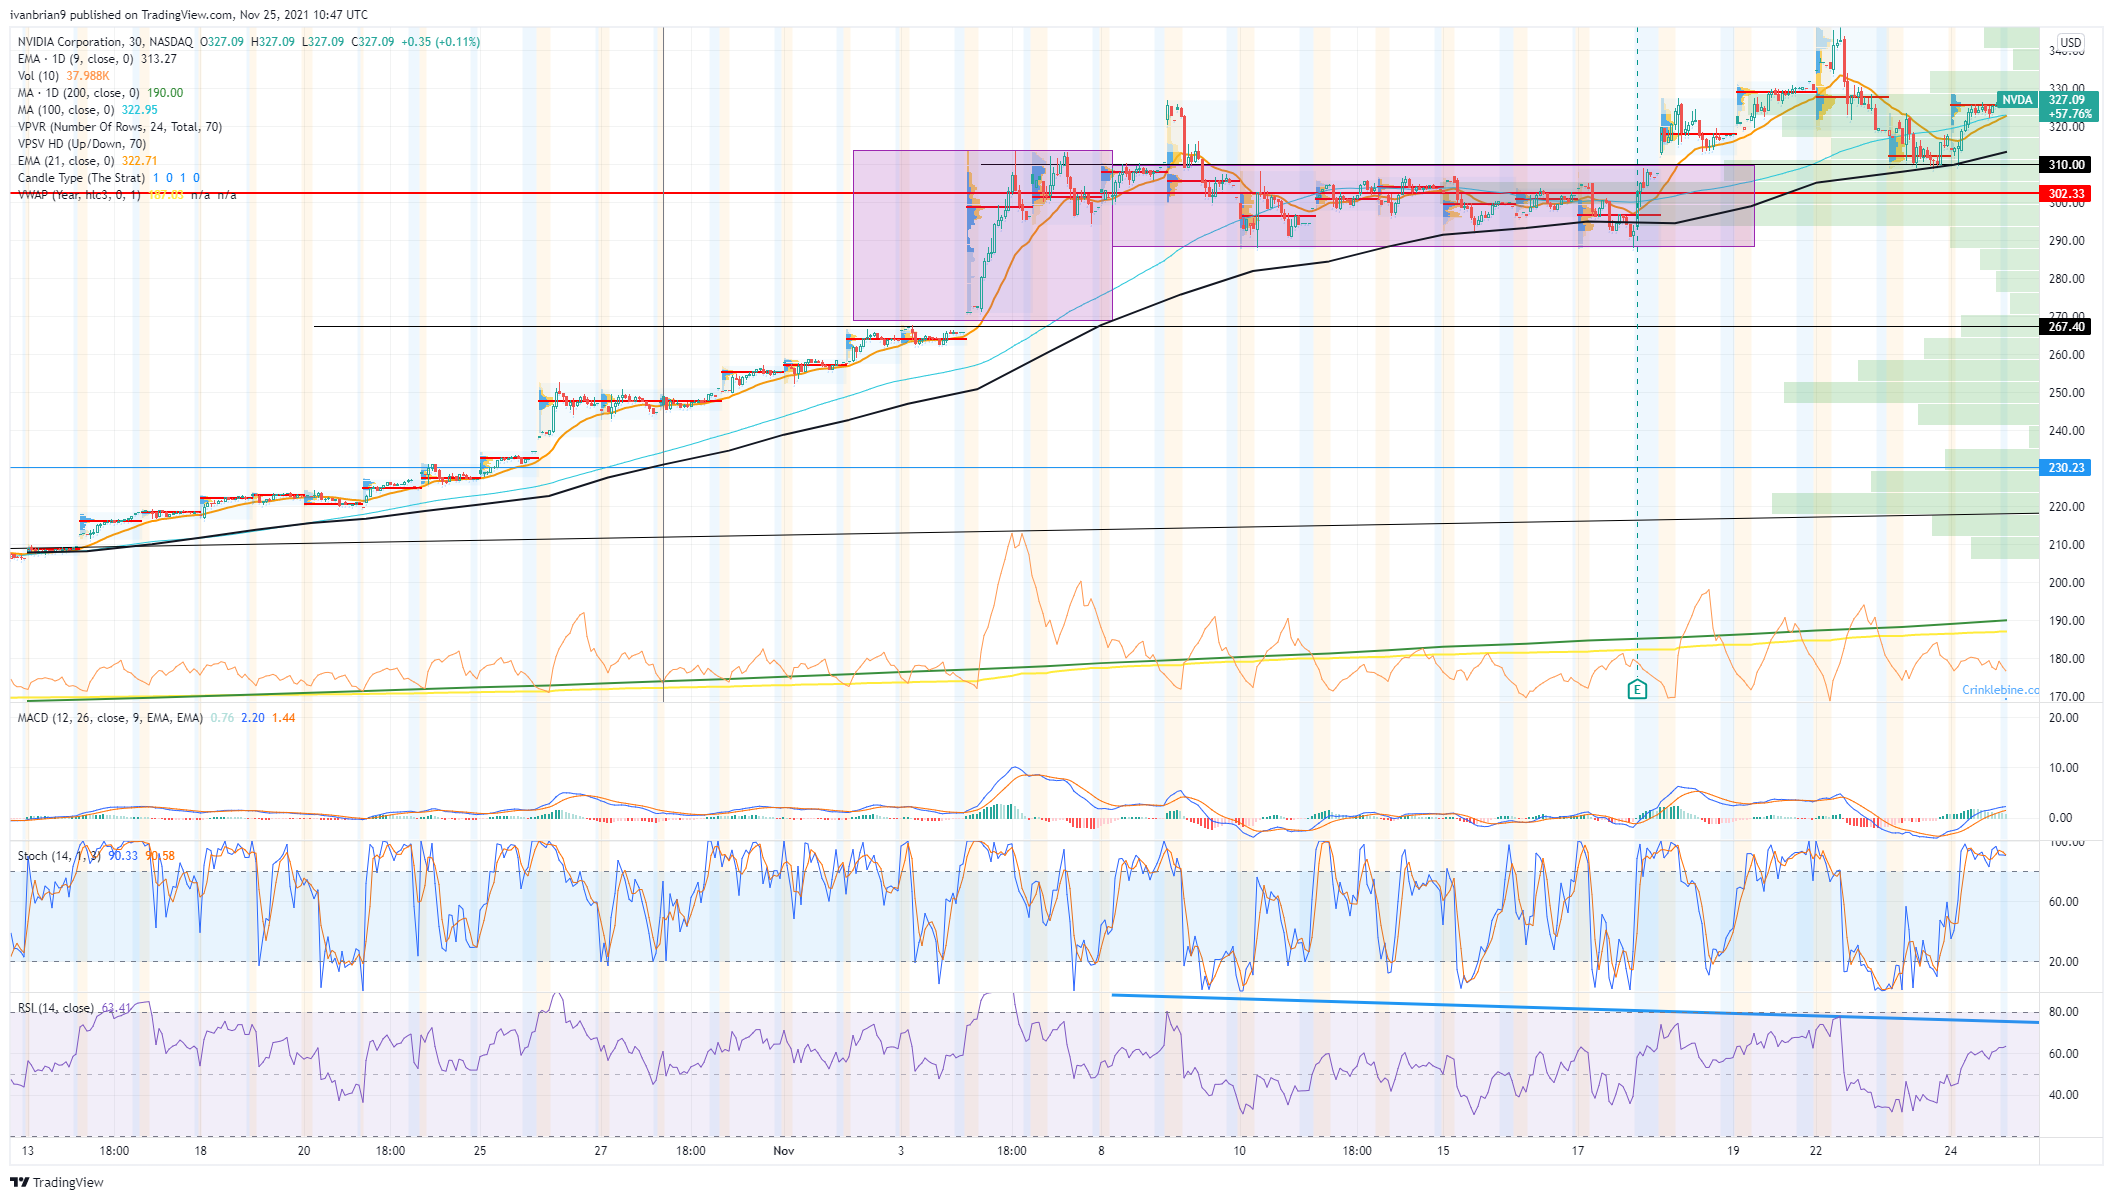
From the 30-minute chart below we can see NVDA stock is just holding support at the top of the flag formation. This flag was formed after the powerful surge on the back of the strong earnings and outlook. $310 is short-term support based on this. In fact, the zone until $300 has a lot of volume, so $310 to $300 is a strong support zone.
The daily chart still shows the strong bullish trend. The bounce from our identified $310 level was strong. As well as the top of the flag, $310 is the 9-day moving average, making it even more important. Falling below $300 will then see the target become $264 – the bottom of the flag pole and the point of the price explosion.
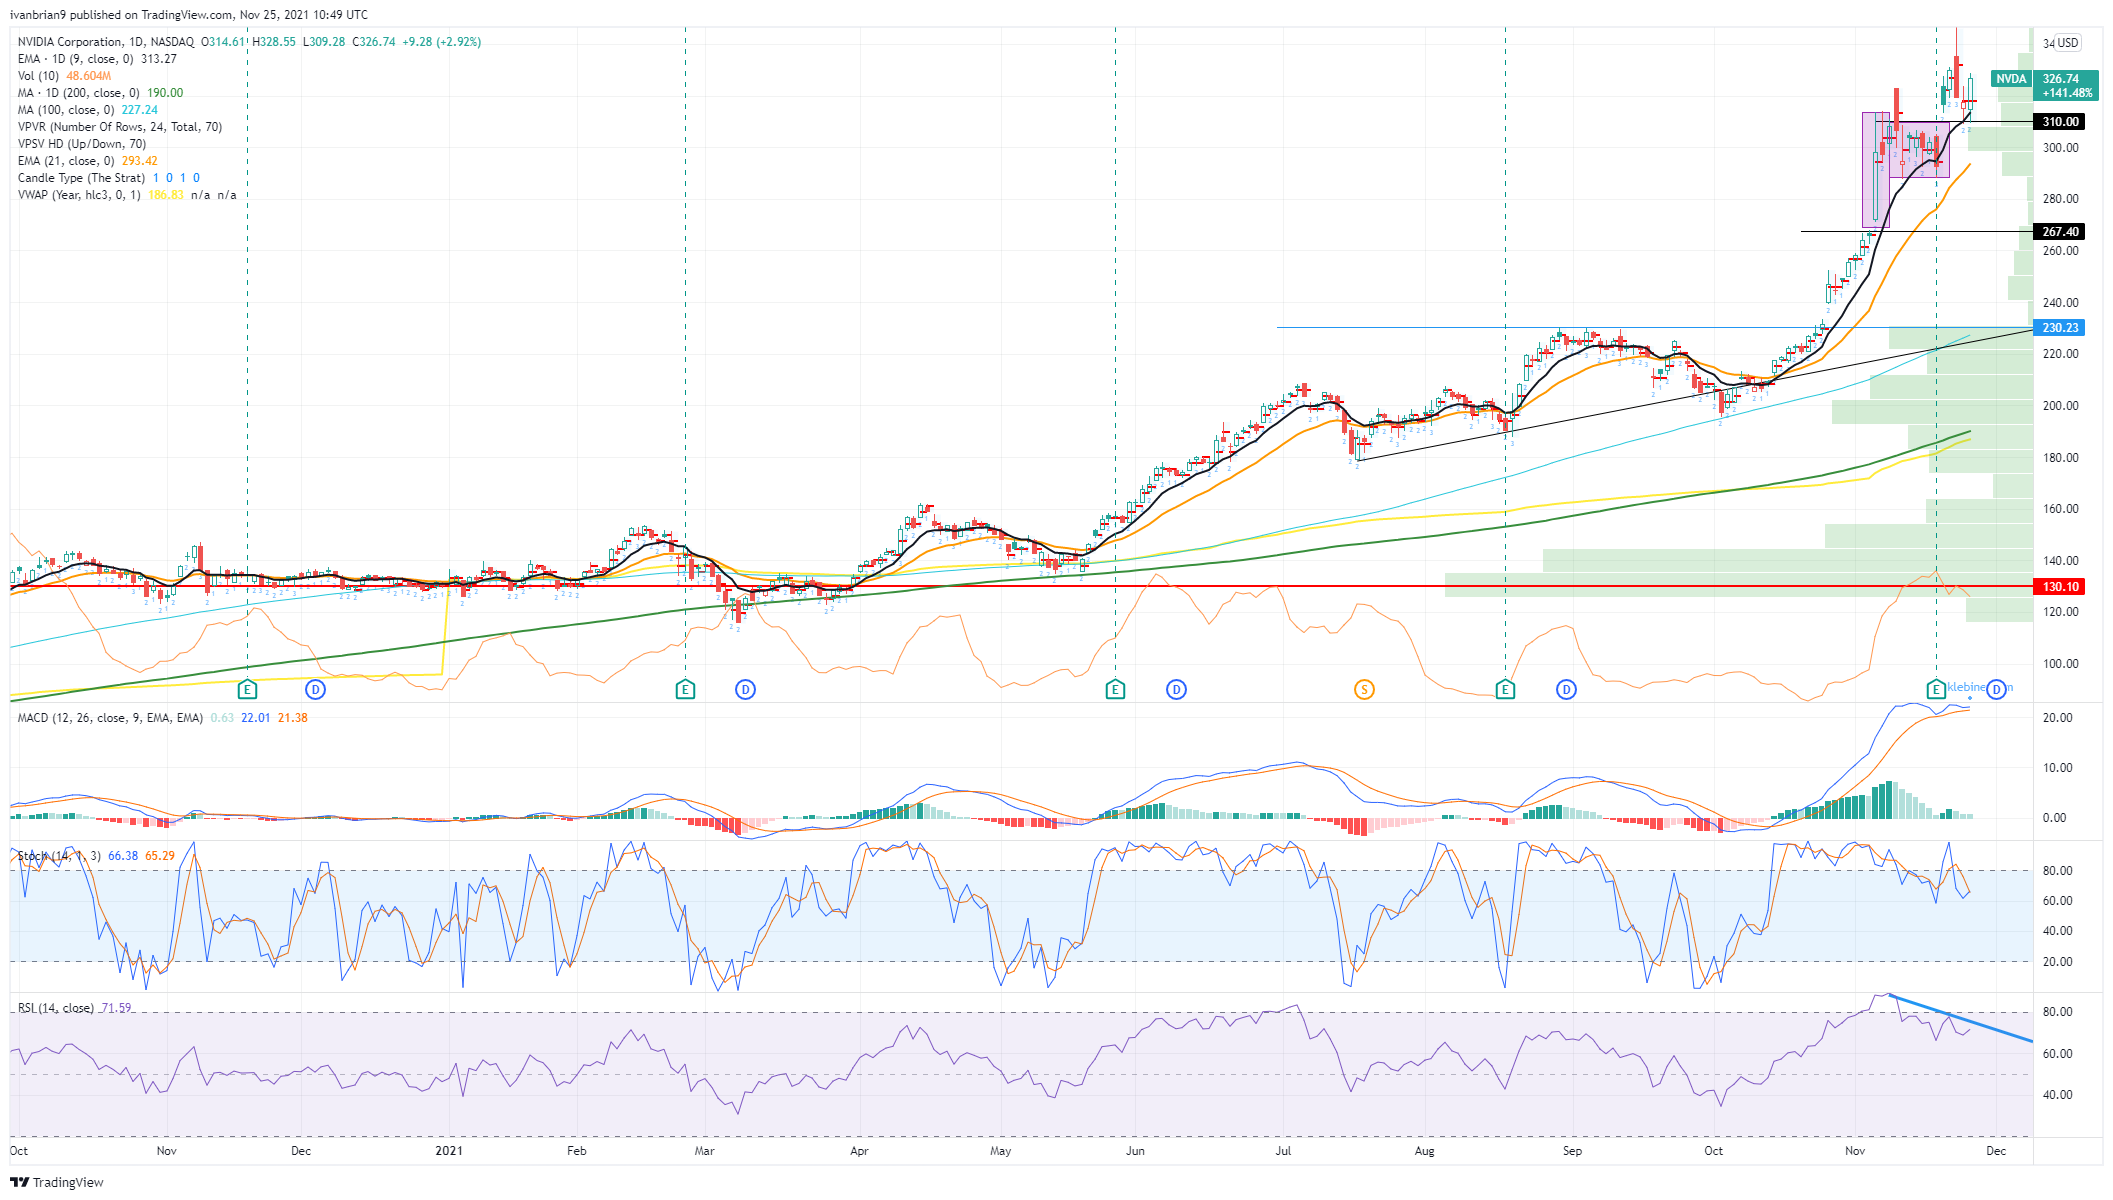
NVDA 1-day chart
Premium
You have reached your limit of 3 free articles for this month.
Start your subscription and get access to all our original articles.
Author

Ivan Brian
FXStreet
Ivan Brian started his career with AIB Bank in corporate finance and then worked for seven years at Baxter. He started as a macro analyst before becoming Head of Research and then CFO.


