NVIDIA Stock (NVDA) gained over 60% from our blue box area

As our members know we have had many profitable trading setups recently. In this technical article, we are going to talk about another Elliott Wave trading setup we got in NVIDIA. The stock has gained more than 60% since we bought it in April. NVDA has completed its correction exactly at the Equal Legs zone, also known as the Blue Box Area. In this article, we’ll break down the Elliott Wave Forecast.
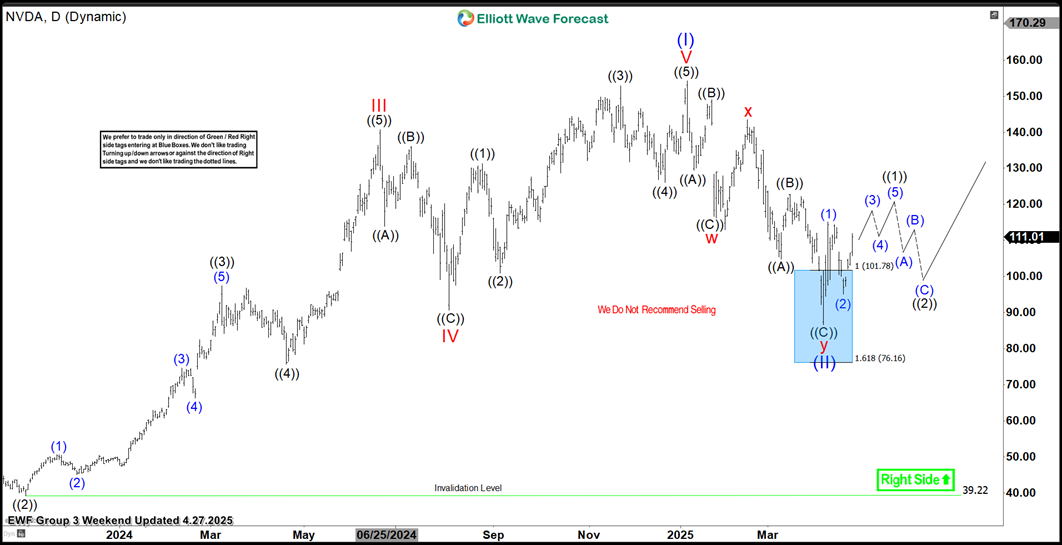
NVDA Elliott Wave daily chart 04.27.2025
The stock has given us a pullback against the 39.22 low. The pullback shows a clear 7-swing pattern, with the Blue Box (buyers’ zone) reached in the 101.78–76.16 area. We are calling the correction completed at the 83.65 low and are expecting a further rally toward new highs. We do not recommend selling the stock in any proposed pullback.
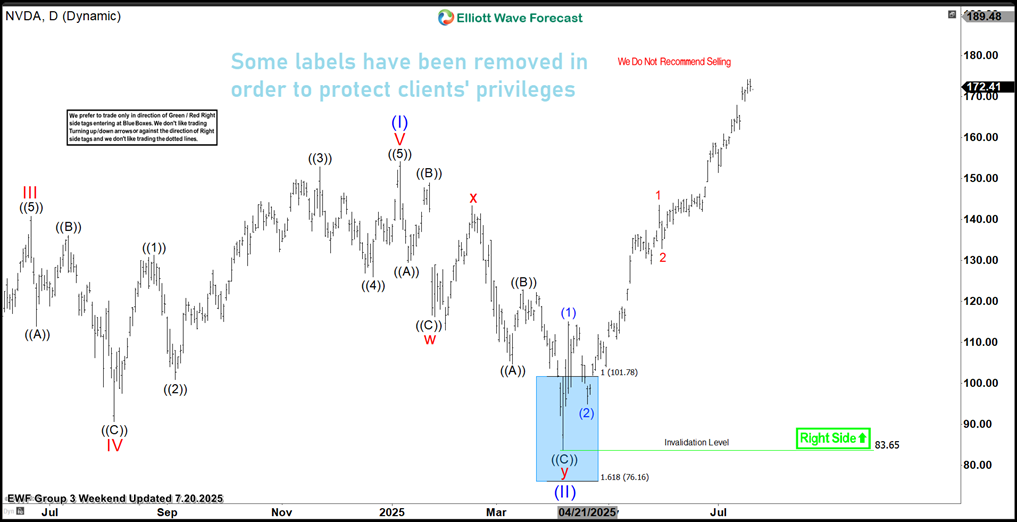
NVDA Elliott Wave daily chart 04.27.2025
In less than three months, we are seeing great results. The stock has continued rallying from the Blue Box, just as expected. NVDA made a strong move toward new all-time highs, gaining more than 60% from our Blue Box buying zone.
Reminder for members: Our chat rooms in the membership area are available 24 hours a day, providing expert insights on market trends and Elliott Wave analysis. Don’t hesitate to reach out with any questions about the market, Elliott Wave patterns, or technical analysis. We’re here to help.
Author

Elliott Wave Forecast Team
ElliottWave-Forecast.com