NVIDIA Corp. (NVDA) Elliott Wave technical analysis [Video]
![NVIDIA Corp. (NVDA) Elliott Wave technical analysis [Video]](https://editorial.fxstreet.com/images/TechnicalAnalysis/ChartPatterns/Candlesticks/foreign-exchange-market-chart-24348895.jpg)
NVDA Elliott Wave Analysis Trading Lounge.
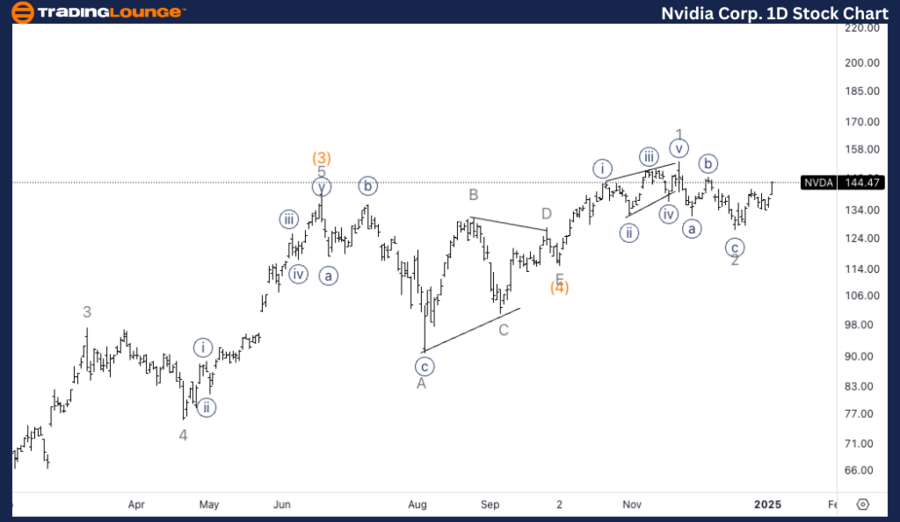
NVIDIA Corp., (NVDA) Daily Chart.
NVDA Elliott Wave technical analysis
Function: Trend.
Mode: Impulsive.
Structure: Motive.
Position: Minor wave 3.
Direction: Upside in 3 of (5).
Details: We are looking at the resumption of the uptrend into wave (5). We are trading slightly below MediumLevel at 150$, looking for support on top of that to confirm the bullish bias.
NVDA Elliott Wave technical analysis – Daily chart
On the daily chart, NVIDIA is currently in Minor wave 3 of the larger wave (5). The uptrend is expected to continue as we look for support around MediumLevel 150$. A successful hold and bounce from this level would confirm the bullish bias and suggest the resumption of the rally toward higher levels. Breaking above 150$ and sustaining above this level would provide further confirmation of the uptrend continuing into wave (5).
NVDA Elliott Wave technical analysis
Function: Trend.
Mode: Impulsive.
Structure: Motive.
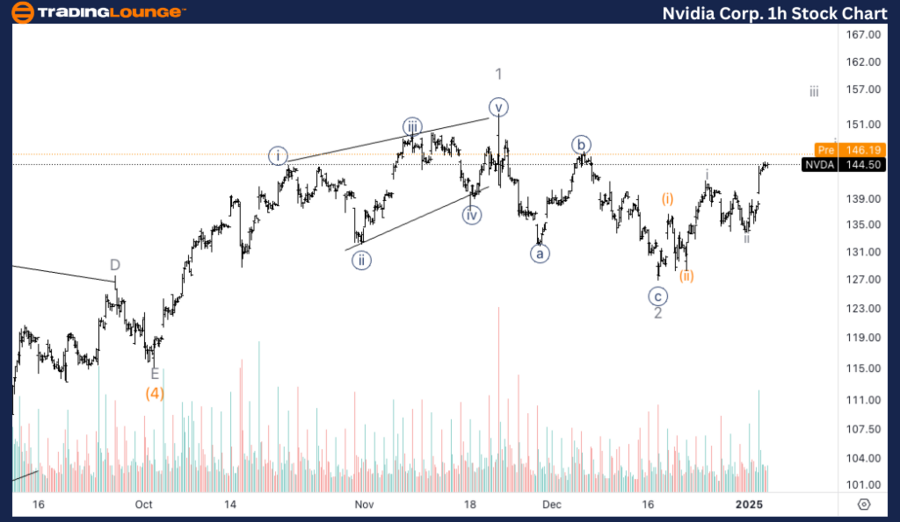
Position: Wave (iii) of {i}.
Direction: Upside into wave (iii).
Details: Looking for a couple of ones-twos within wave {i} to break through 150$. The next pullback will be crucial as it shall not cross with wave i.
NVDA Elliott Wave technical analysis – One-hour chart
The 1-hour chart suggests the development of wave (iii) of {i} within the larger impulsive structure. NVIDIA is likely building momentum with a series of ones and twos (internal wave subdivisions) within wave {i} to break through 150$. The next pullback will be crucial, and it must not retrace into the territory of wave i to maintain the integrity of the impulsive move. A break above 150$ with strong momentum would indicate further upside in wave (iii).
This Elliott Wave analysis for NVIDIA Corp., (NVDA) examines both the daily and 1-hour charts to assess its current market trend, utilizing Elliott Wave Theory to anticipate potential future movements.
NVIDIA Corp. (NVDA) Elliott Wave technical analysis [Video]
Author

Peter Mathers
TradingLounge
Peter Mathers started actively trading in 1982. He began his career at Hoei and Shoin, a Japanese futures trading company.