Novo Nordisk is up over 45% in a month— Key resistance levels to watch

Novo Nordisk (NVO) has seen an impressive push higher over the past month, with the stock up more than 45% in a relatively short period of time. Moves like this do not happen in a vacuum, and the recent strength in NVO has clearly reflected renewed optimism around the company and its product pipeline. From my perspective, this has been a strong momentum-driven run, and now the focus shifts from the move itself to how price behaves around key technical areas overhead.
The rally in Novo Nordisk was fueled by positive sales forecasts and the approval of its Wegovy product for use in larger doses in the United Kingdom. That combination provided the catalyst needed to drive buyers back into the name in a meaningful way. When I see a stock move this far this fast, I always begin narrowing my focus to the technicals and identifying where price may reasonably pause, consolidate, or pull back.
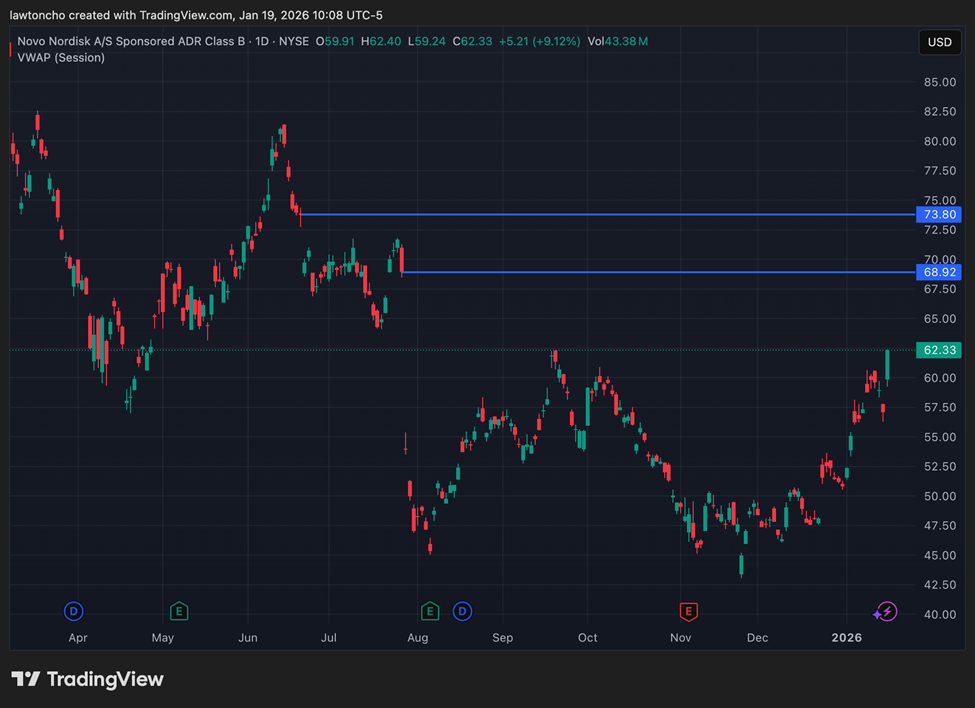
From a technical standpoint, there are two primary resistance regions I am paying close attention to. The first is the $69 area, which represents a gap fill from July 29 of last year. Gap fill zones often act as natural areas of friction, and this level stands out clearly on the chart. If NVO approaches this region, I will be watching closely to see whether price stalls or reacts.
The second resistance level I am targeting sits higher, near the $74 region. This area corresponds with an additional gap fill from June 20 of last year. Should the stock continue higher through the first level, this zone becomes the next logical area where sellers may step in. These levels are not predictions, but rather reference points derived from the chart that help frame risk and expectations.
For background, Novo Nordisk is a pharmaceutical company that has been in focus due to the success and expansion of its Wegovy product. That product has played a central role in recent investor interest and has directly contributed to the stock’s strong performance over the past month. Understanding that context helps explain why momentum has accelerated, but my approach remains grounded in price action and technical structure rather than headlines alone. The stock also pays a quarterly dividend that is projected to rise to $1.73 per share in 2026, more than a 19% increase from the most recent dividend payment in August.
As always, regardless of how strong a stock looks or how compelling the recent move has been, proper risk management is essential. I approach trades with defined levels and disciplined sizing, letting the technicals guide my decisions rather than emotion.
Author

Lawton Ho
Verified Investing
A marketing expert sharing his journey to mastering the charts.


