Meme Coins Price Prediction: Dogecoin, Shiba Inu, Pepe in a freefall, echoing Bitcoin’s drop
- Dogecoin is down over 3% on Monday as the MACD indicator flashes a sell signal.
- Shiba Inu edges lower by 3%, extending the decline for three consecutive days.
- Pepe extends the downtrend for the sixth day, recording a 4% drop on Monday.

Meme coins, such as Dogecoin (DOGE), Shiba Inu (SHIB), and Pepe (PEPE), extend the decline from last week, with a roughly 3% drop on Monday. The meme coins trade below the crucial moving averages, aiming for the immediate support to potentially reset the momentum.
The decline in Dogecoin, Shiba Inu, and Pepe aligns with the broader market pullback, as Bitcoin (BTC) drops below $93,000 on Monday after a leverage-driven rally failed to hold momentum.
Dogecoin risks further correction as selling pressure mounts
Dogecoin is down 3% at press time on Monday, extending the correction phase for the sixth straight day. The meme coin steadies below the 20-day Exponential Moving Average at $0.1375 and the 50-day EMA at $0.1417, maintaining a bearish setup as both averages slope lower, capping recovery attempts. Additionally, the 200-day EMA at $0.1718 is trending lower, supporting the broader bearish bias.
The Moving Average Convergence Divergence (MACD) histogram has slipped into negative territory and is expanding, with the MACD line below the signal line near the zero mark, suggesting strengthening bearish momentum.
The Relative Strength Index (RSI) at 39 reflects an increase in selling pressure, nearing the oversold zone.
To improve the tone, DOGE should secure a daily close above the descending trendline connecting the October 27 and January 14 highs.
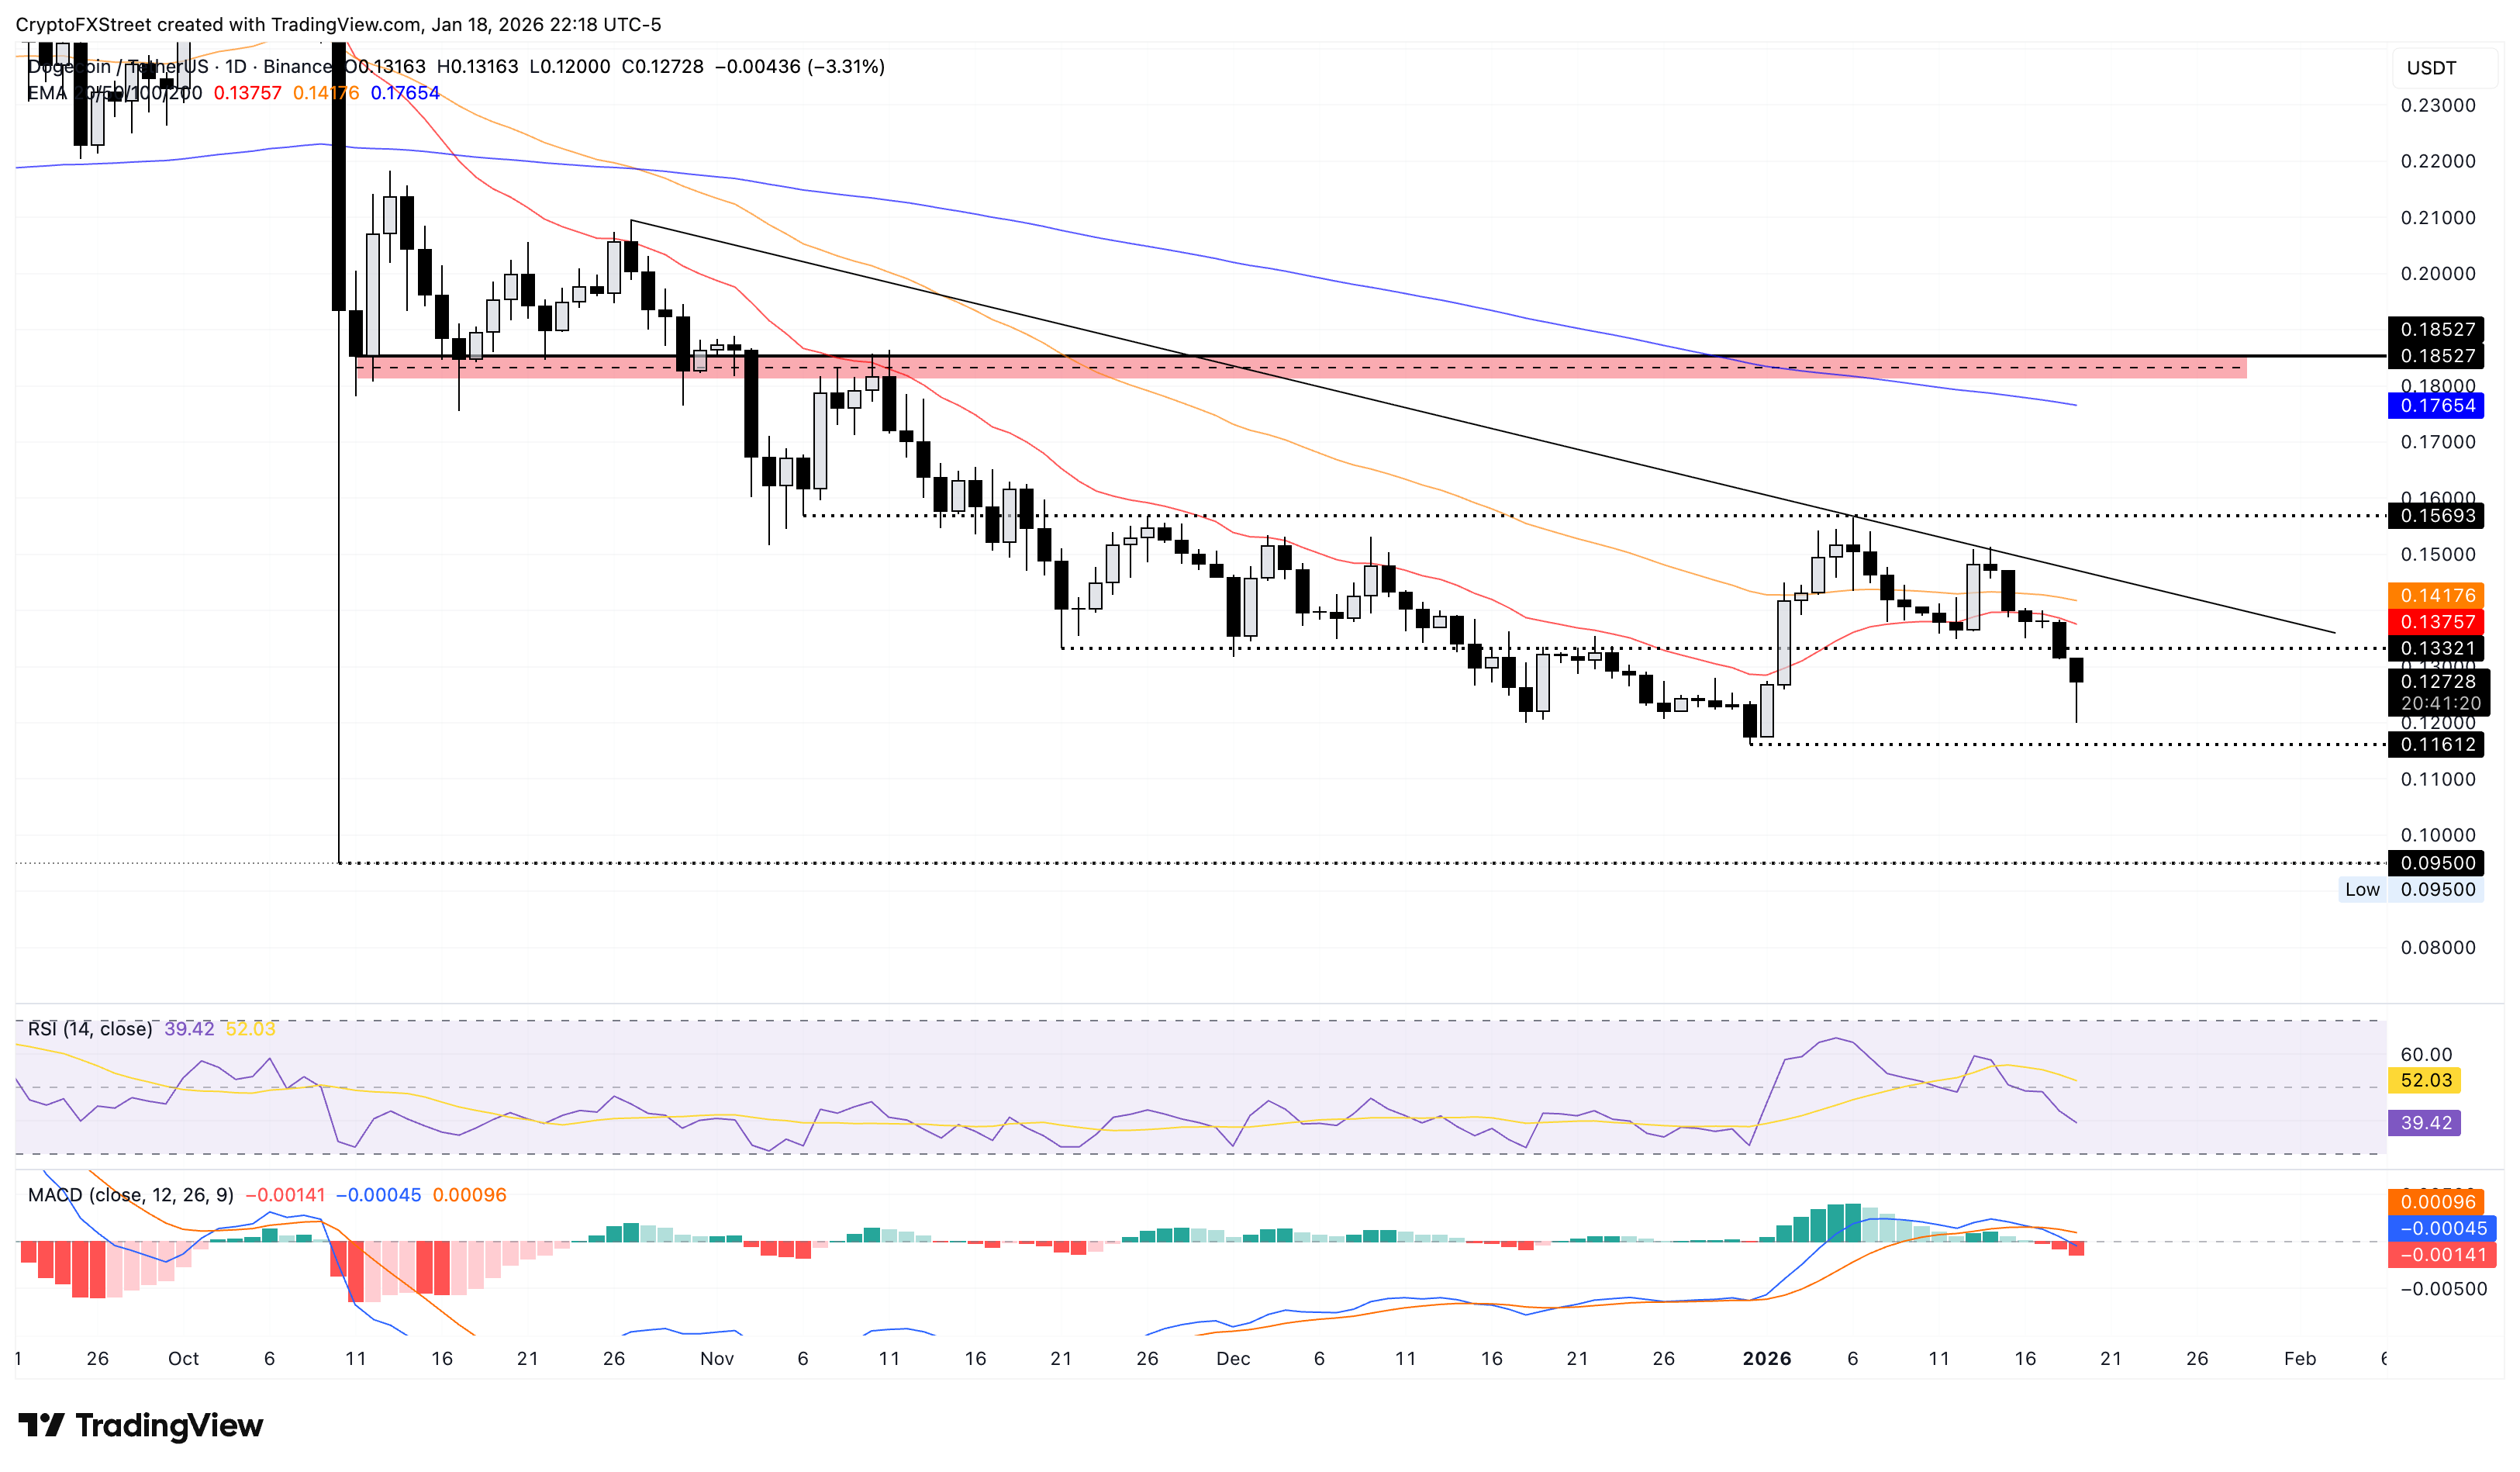
On the downside, if DOGE slips below the December 31 low at $0.1161, it could target the October 10 low at $0.09500.
Shiba Inu extends declining trend amid bearish momentum shift
Shiba Inu edges lower by nearly 3% at the time of writing on Monday, extending the 4% decline from last week. The 20-day EMA reverses from the 50-day EMA, overlapping near the price, underscoring a renewed bearish shift.
If SHIB continues the correction, it could target the October 10 low at $0.00000678.
The MACD and its signal line are nearly aligned around zero, and the histogram is flat, reinforcing a neutral tone. RSI at 43 (neutral) and easing suggests fading upside momentum.
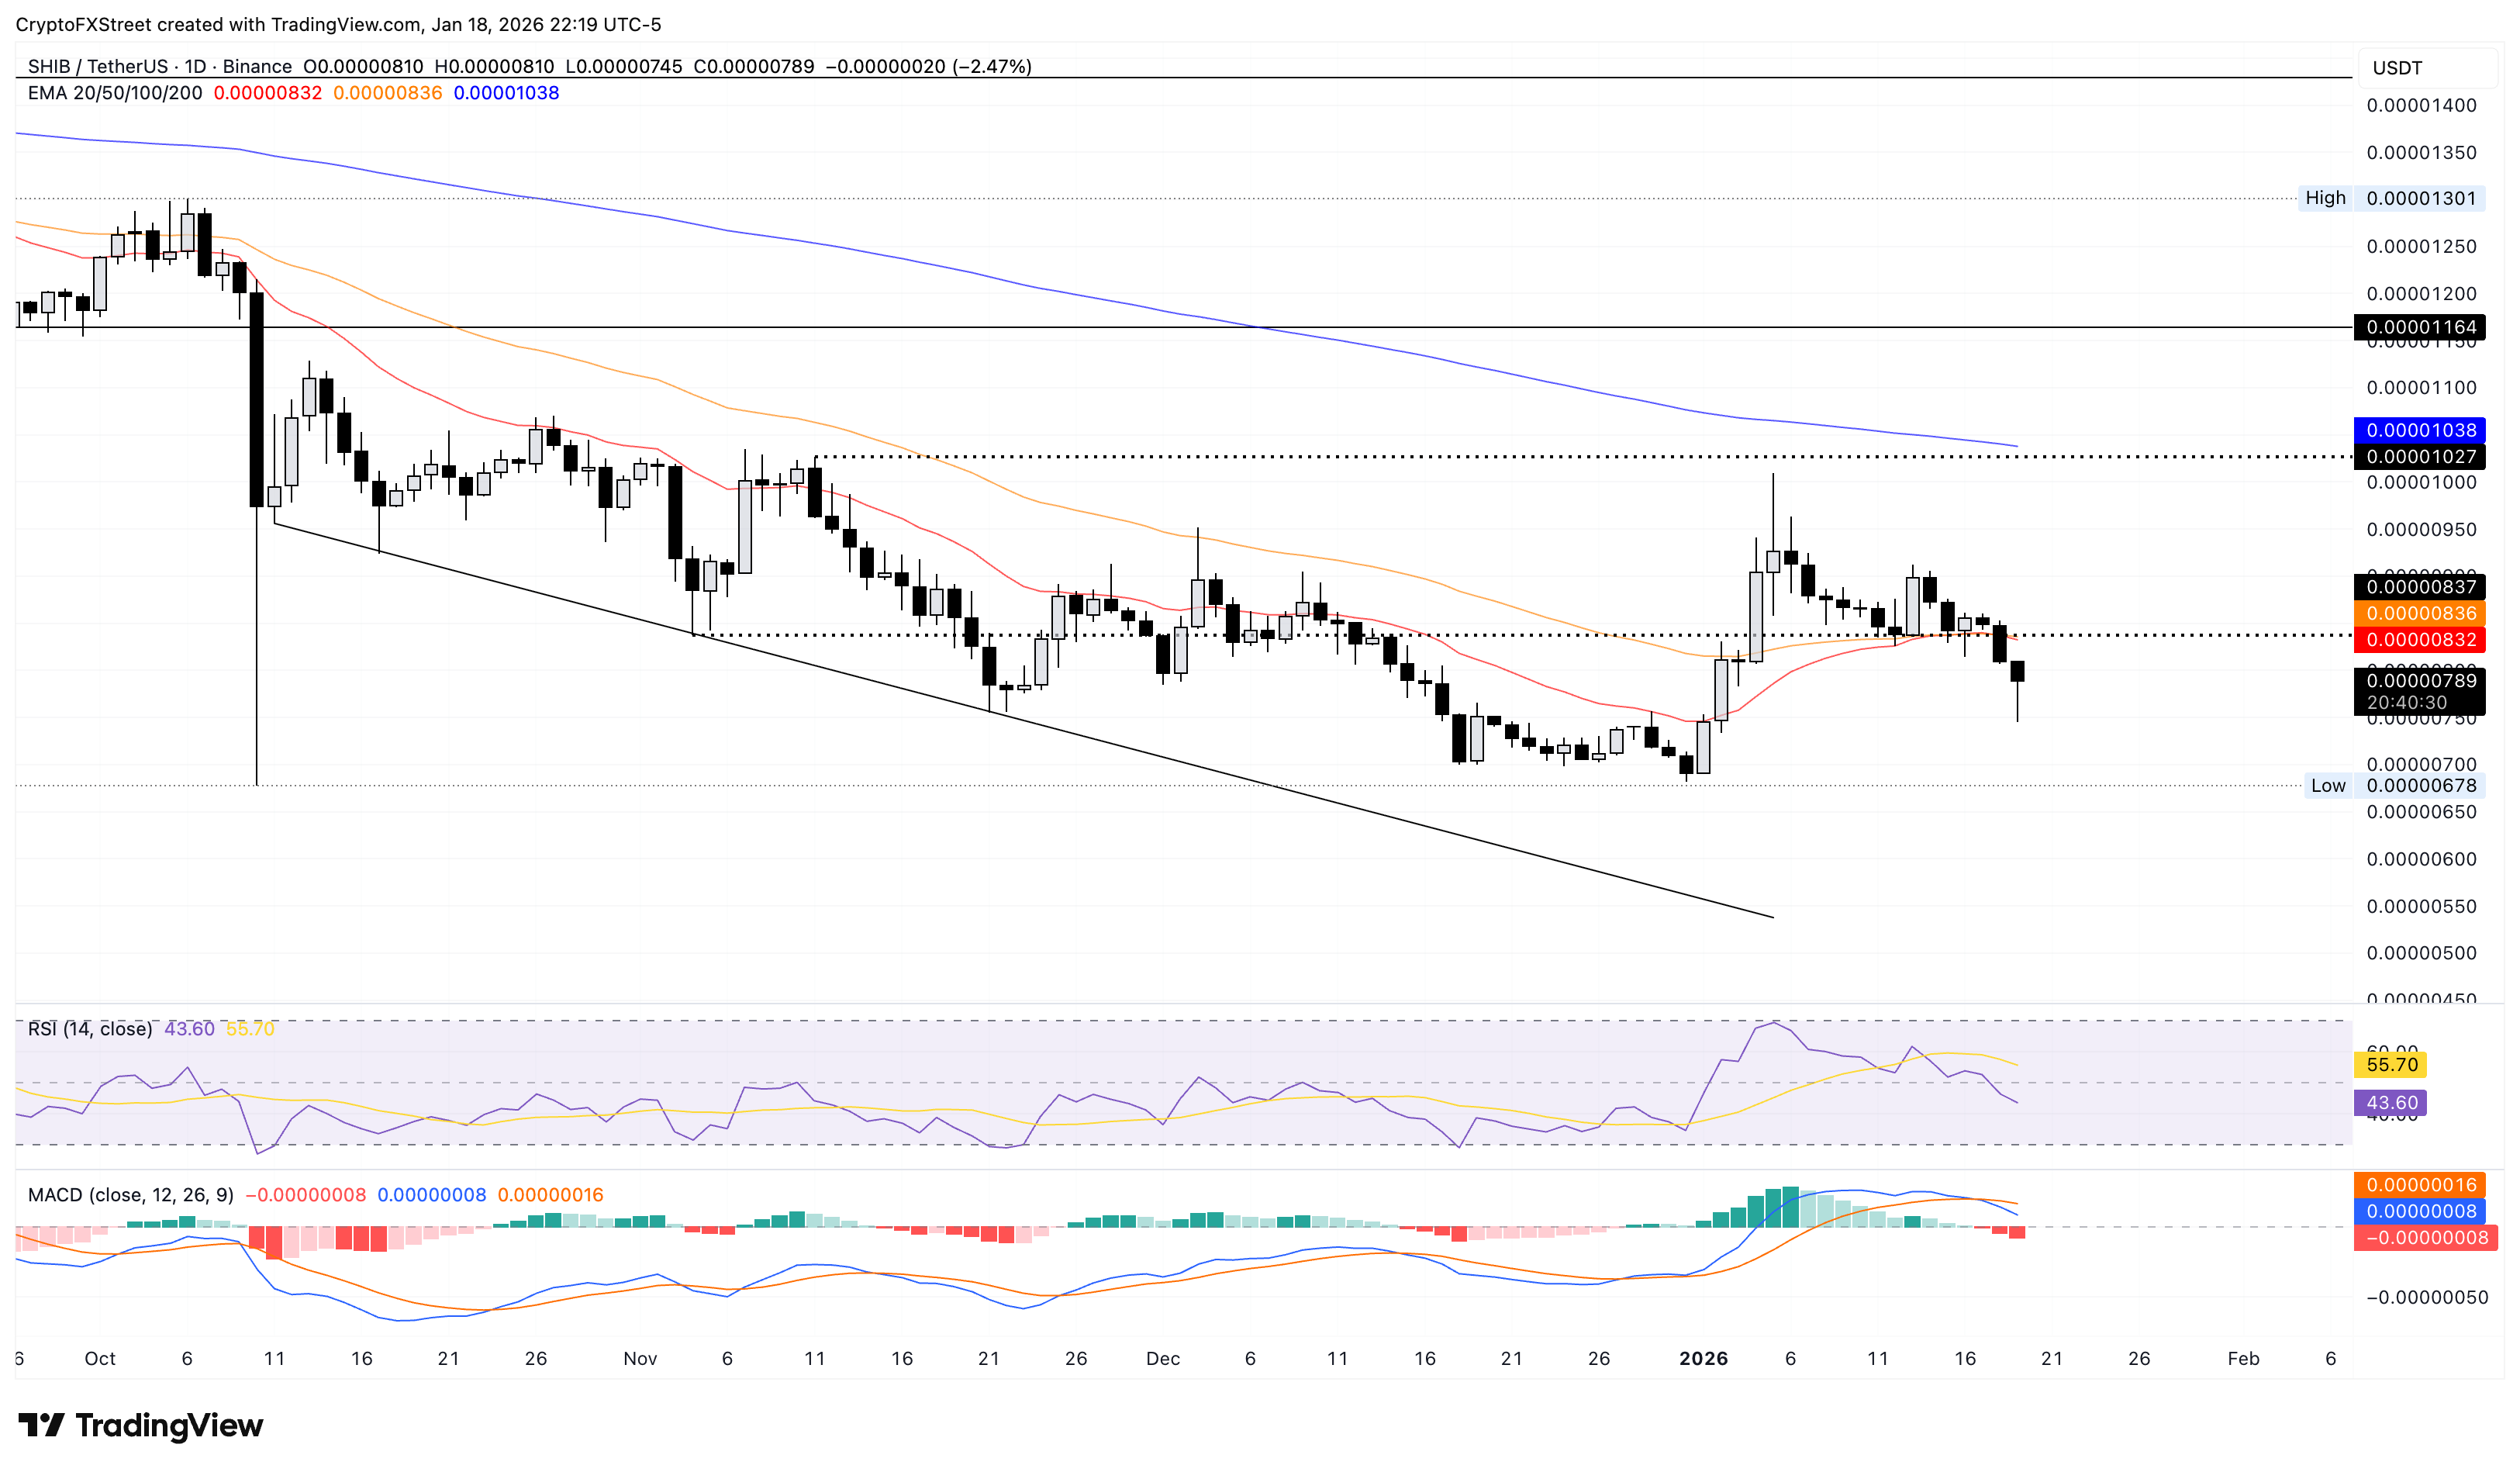
A decisive break above the congested 20- and 50-day EMAs at $0.00000836 would likely unlock upside momentum.
Pepe’s declining trend gains traction
Pepe remains under extreme selling pressure, starting its third consecutive bearish week. At the time of writing, the frog-themed meme coin is down 4% on Monday, crossing below the 50-day EMA at $0.00000541.
If the declining trend continues below the $0.00000500 psychological support level, it could extend to the December 18 low at $0.00000363.
The MACD crosses below the signal line, aiming toward zero, and the rising negative histogram bars reinforce a bearish tone. The RSI at 43 crosses under the halfway line, suggesting a sell-side bias.
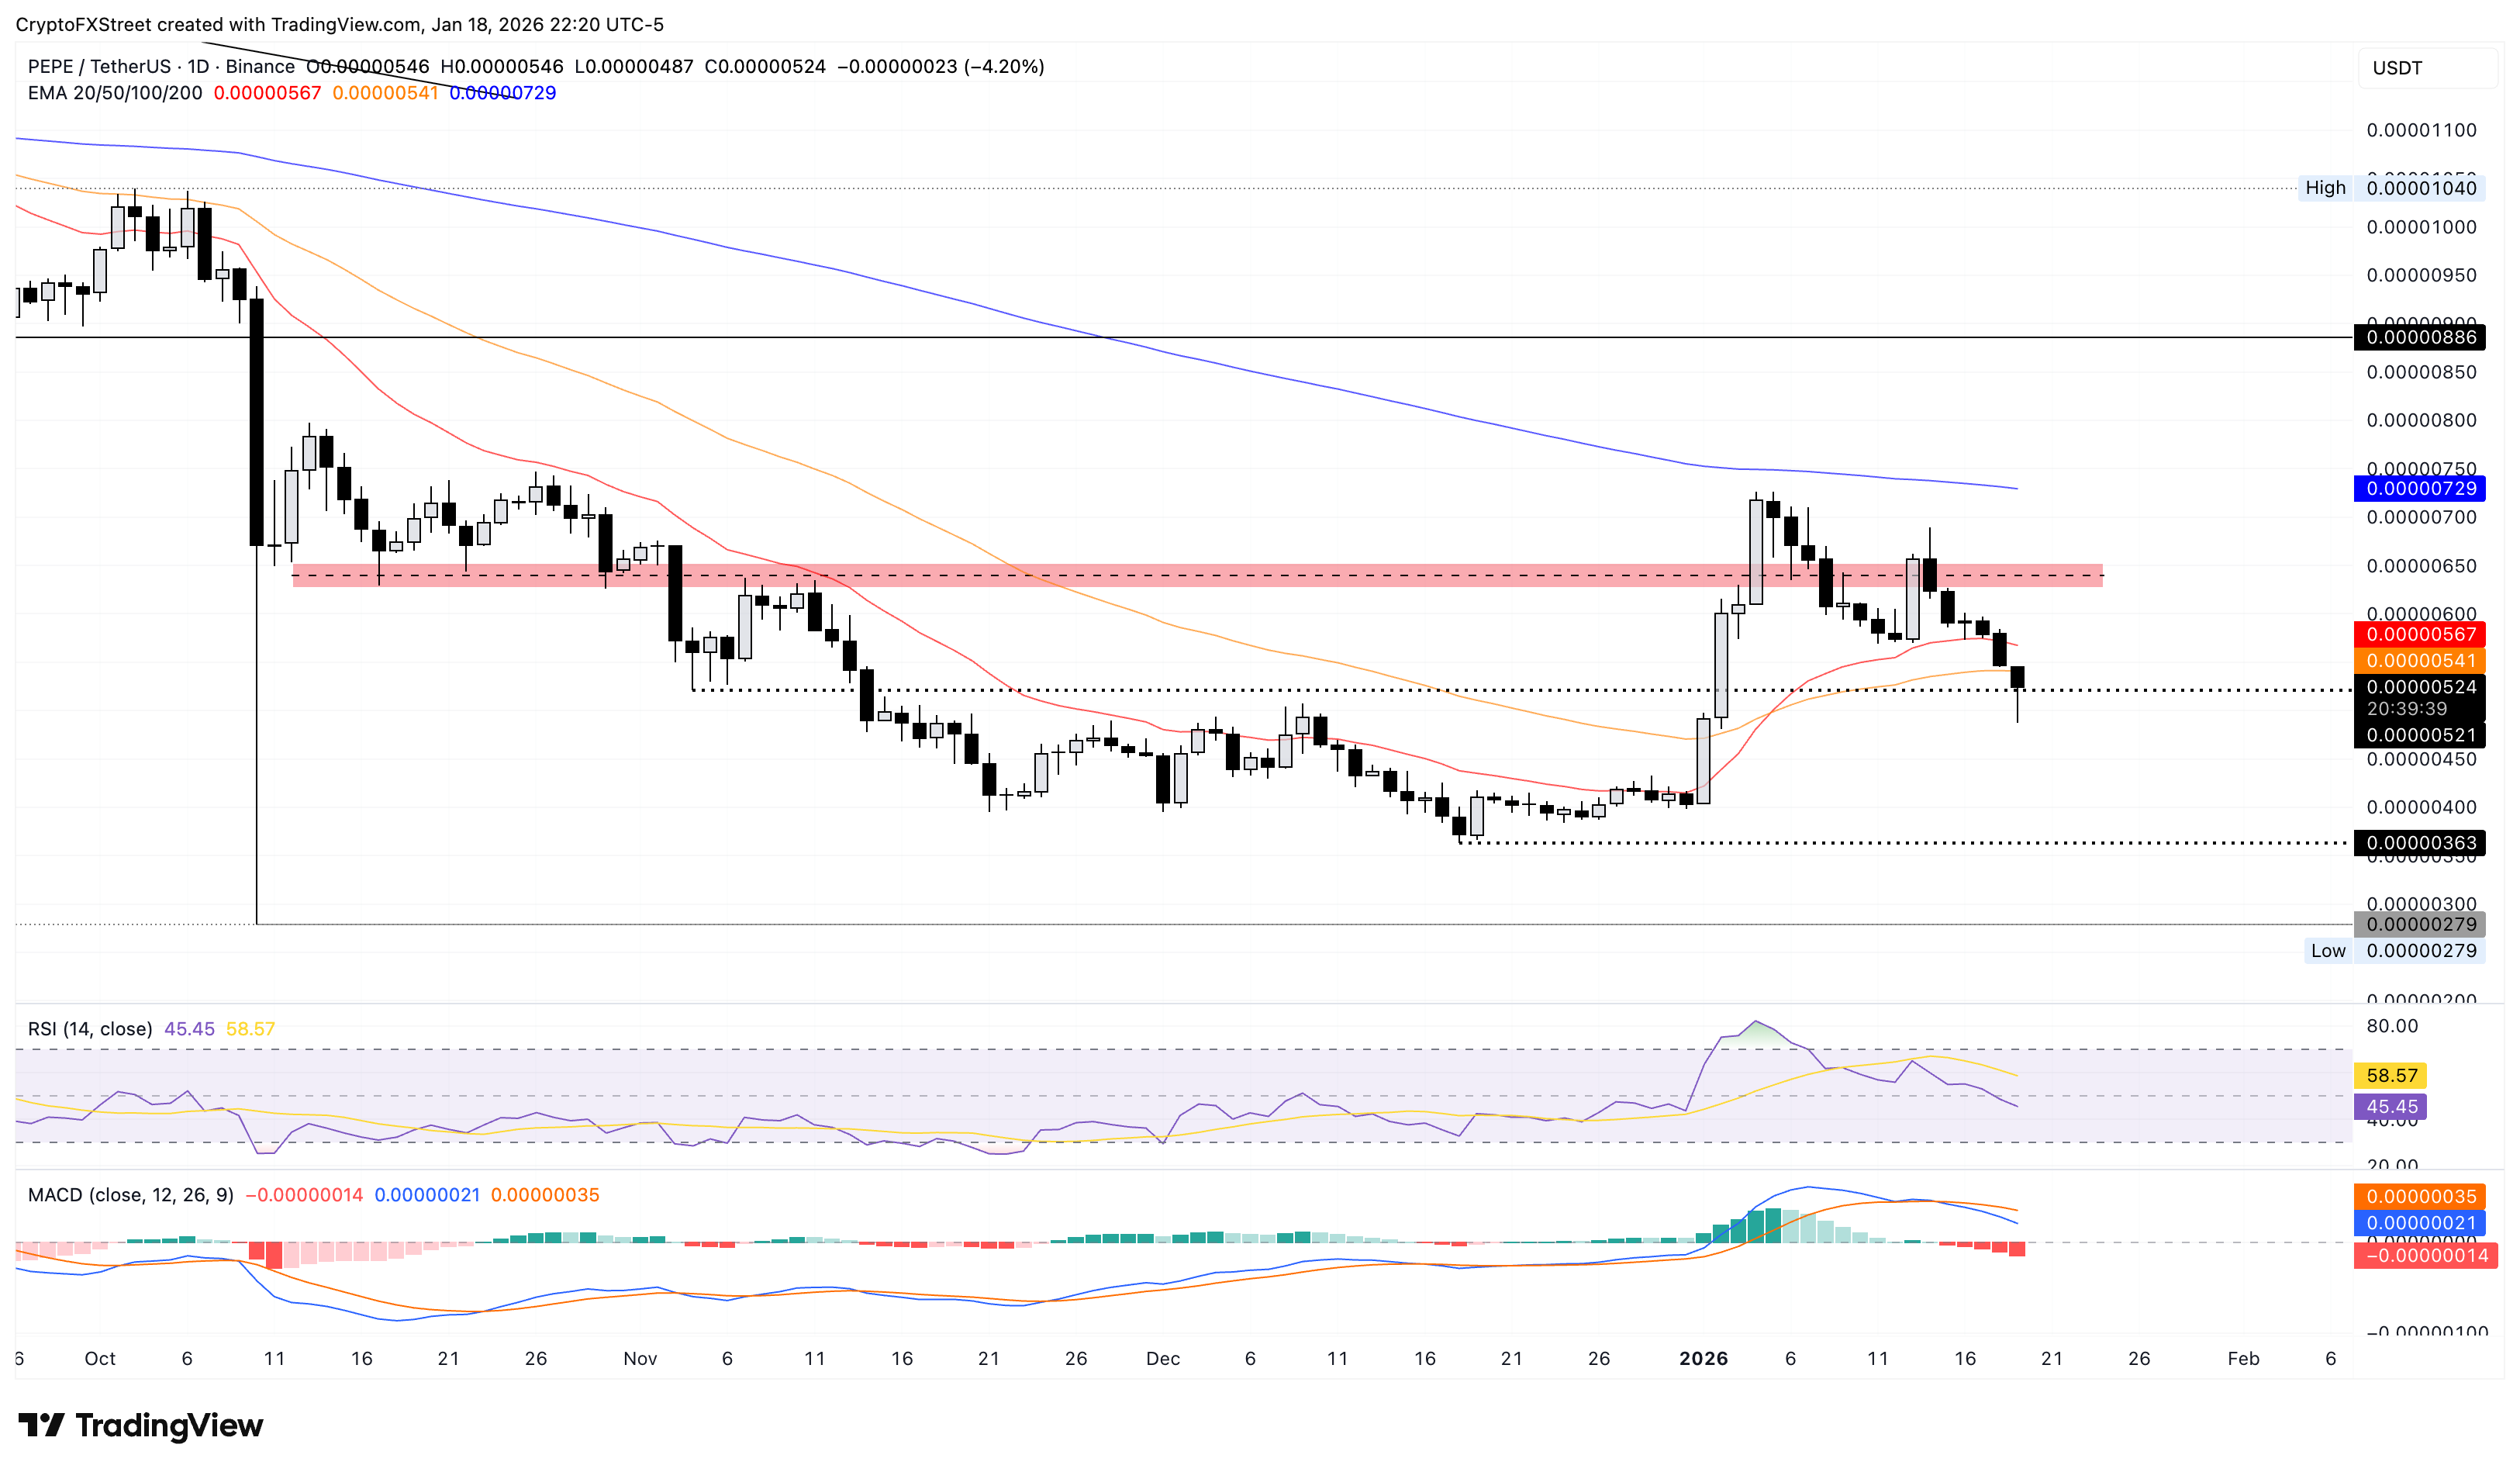
The 20-day EMA at $0.00000567 could act as overhead resistance, capping a potential rebound.
(The technical analysis of this story was written with the help of an AI tool.)
Author

Vishal Dixit
FXStreet
Vishal Dixit holds a B.Sc. in Chemistry from Wilson College but found his true calling in the world of crypto.