|

Novo Nordisk continues to fall: Where I am buying the stock

Novo Nordisk (NVO) had another tough session yesterday, finishing more than 2% lower compared to Friday’s close. The pharmaceutical company behind well-known drugs like Wegovy and Ozempic has struggled throughout the year, and the stock now sits more than 50% below its highs from earlier in 2024. Watching the recent price action pull back this sharply, I’ve been focusing closely on the technicals to determine where I want to step in.

Before getting into my levels, I want to share some brief background on Novo Nordisk and why the stock is on my radar. The company has grown into one of the most recognizable names in the pharmaceutical space, with its work in metabolic and chronic disease treatments becoming a central part of its identity. As demand for its leading products increased, so did market interest—making this year’s steep decline even more notable. With that backdrop, I’m approaching the pullback with patience, relying on technicals to guide where I believe the next high-probability opportunities may form.

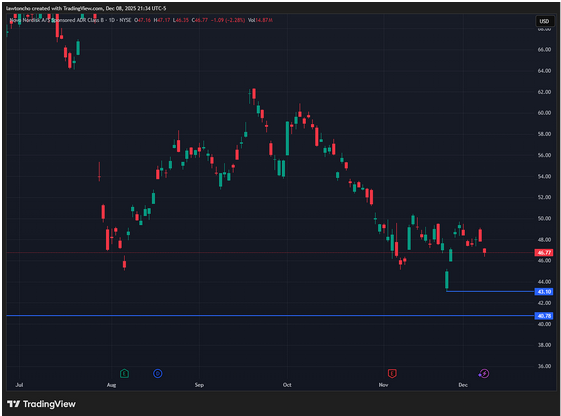
As NVO continues to slide, I’m mapping out the exact levels where I plan to buy. The first area I am watching is near the $43 region, which represents the most recent pivot low and the lowest price the stock has hit this year. If we revisit that zone, I expect it to act as meaningful support and potentially trigger a reaction bounce. My secondary level sits lower, lining up with a gap fill around $40.78. Whenever a stock approaches a gap, I treat it as an area of interest, and in this case it’s a clear technical target that I will be ready for if the chart gets there.

These two levels are where I anticipate the strongest probability of a bounce in NVO. As always, no matter how clean the technicals look, proper risk management remains the foundation of every trade I take. Nothing in the market is guaranteed, and respecting risk is just as important as identifying opportunity.

Chart

Author

Lawton Ho

Lawton Ho

Verified Investing

A marketing expert sharing his journey to mastering the charts.

More from Lawton Ho
Share:

Editor's Picks

EUR/USD falls to near 1.1600 due to persistent bearish bias

EUR/USD depreciates after registering modest gains in the previous session, trading around 1.1610 during the Asian hours on Thursday. The technical analysis of the daily chart suggests a persistent bearish bias as the EUR/USD pair remains within the descending channel pattern.

GBP/USD underperforms as UK faces stagflation risks amid Middle East war

The Pound Sterling trades lower against its major currency peers, is down 0.22% around 1.3340 against the US Dollar, during the Asian trade on Thursday. The British currency faces selling pressures amid fears that the United Kingdom economy could face stagflation risks due to higher energy prices, a situation in which inflation accelerates with economic growth and employment conditions remaining stagnant.

Gold climbs near $5,200 as Iran war fuels safe-haven demand

Gold price extends its gains for the second successive session on Thursday as traders seek safety amid the ongoing war in the Middle East. US and Israeli strikes across Iranian territory and widespread Iranian missile and drone retaliation across the Middle East, including attacks on regional targets and military sites, prolong the crisis and its impact.

Top Crypto Gainers: Decred, Zcash, and Dogecoin lead recovery as Bitcoin crosses $72,000

Bitcoin trades above $72,500 at press time on Thursday, holding its 6% gain from the previous day, contributing to a broader market recovery. The total cryptocurrency market capitalization stands at over $2.43 trillion as the broader market sentiment improves significantly.

First Venezuela, now Iran: The US-China energy war escalates

At first glance, the latest escalation involving the United States with both Iran and Venezuela looks like another chapter in a long-running geopolitical story. But viewed through a broader strategic lens, something else may be unfolding: Energy.

Cardano Price Analysis: Approaches key trendline amid bearish sentiment

Cardano (ADA) price is approaching its descending trendline around $0.28 at the time of writing, set to shape the next directional move. The derivatives metrics paint a bearish picture, with ADA’s Open Interest continuing to fall and short bets rising among traders.