Northern Star Resources Ltd Elliott Wave forecast [Video]
![Northern Star Resources Ltd Elliott Wave forecast [Video]](https://editorial.fxsstatic.com/images/i/General-Stocks_1_XtraLarge.png)
ASX: NST Elliott Wave technical analysis
Today's Elliott Wave analysis provides an update on NORTHERN STAR RESOURCES LTD – NST on the Australian Stock Exchange (ASX).
We identify upside potential for ASX:NST, but before the ((iii)) - navy wave advances, we anticipate a pullback with the ((ii)) - navy wave. Additional time is required before the trend shifts. This analysis will highlight critical price levels, helping traders recognize trend reversals and detect invalidation points.
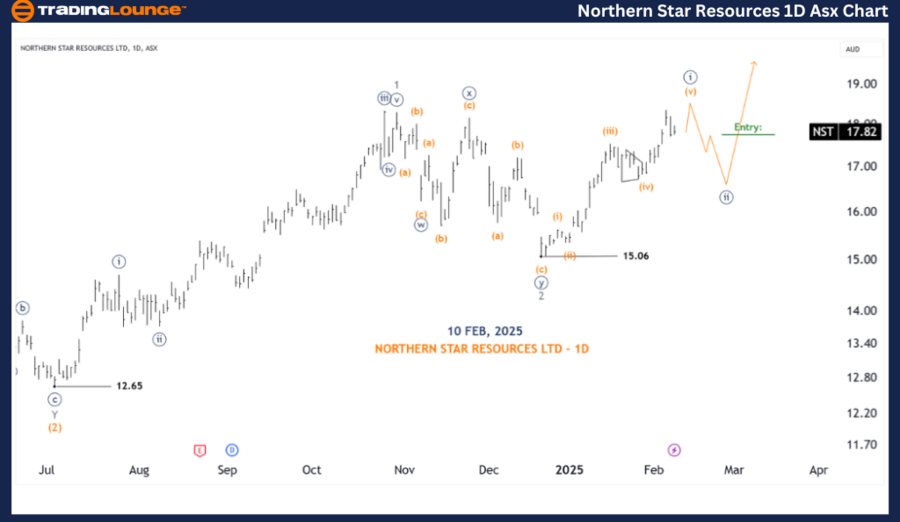
ASX: NST Elliott Wave technical analysis (one-day chart - Semilog scale)
-
Function: Major trend (Intermediate degree, orange).
-
Mode: Motive.
-
Structure: Impulse.
-
Position: Wave (v) - orange of Wave ((I)) - navy.
Details:
The Wave 2 - grey appears to have completed as a Double Zigzag, and since reaching 15.06, Wave 3 - grey is trending upward.
Recent price action suggests Wave ((ii)) - navy is approaching completion and setting up for a rally with Wave ((iii)) - navy. Wave ((i)) - navy is likely concluding as a five-wave pattern, preparing for a downward move with Wave ((ii)) - navy.
Traders should consider entering long positions after Wave ((ii)) - navy finalizes and a price surge beyond Wave B confirms an uptrend.
- Invalidation point: 15.06
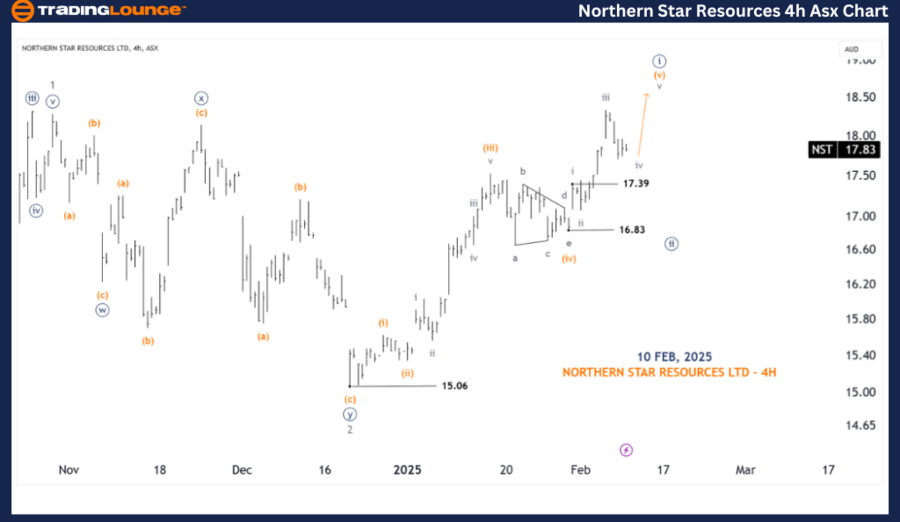
ASX: NST Elliott Wave technical analysis (four-hour chart)
-
Function: Major trend (Minute degree, navy).
-
Mode: Motive.
-
Structure: Impulse.
-
Position: Wave (v) - orange of Wave ((v)) - navy.
Details:
Upon closer inspection, Wave (v) - orange of Wave ((i)) - navy is nearly completed. A pullback with Wave ((ii)) - navy is expected before resuming the uptrend with Wave ((iii)) - navy.
If the price drops below 17.39, there is a strong likelihood that Wave ((ii)) - navy is still unfolding.
-
Invalidation point: 15.06.
-
Key level: 17.39.
Conclusion
Our analysis provides a contextual market outlook and short-term forecast for ASX: NORTHERN STAR RESOURCES LTD – NST. We highlight crucial validation and invalidation price points to strengthen market confidence.
By integrating these technical factors, we aim to deliver a professional and objective perspective, assisting traders in capitalizing on market trends effectively.
Northern Star Resources Ltd Elliott Wave forecast [Video]
Author

Peter Mathers
TradingLounge
Peter Mathers started actively trading in 1982. He began his career at Hoei and Shoin, a Japanese futures trading company.


