Northern Star Resources Ltd analysis and Elliott Wave forecast [Video]
![Northern Star Resources Ltd analysis and Elliott Wave forecast [Video]](https://editorial.fxstreet.com/images/TechnicalAnalysis/ChartPatterns/PointFigure/hand-point-to-graph-on-financial-graphs-success-concept-73251403_XtraLarge.jpg)
ASX: NST Elliott Wave technical analysis
Greetings, Our Elliott Wave analysis today updates the Australian Stock Exchange (ASX) with NORTHERN STAR RESOURCES LTD – NST. We see ASX:NST stock starting a Bullish trend, and this analysis will show the optimal and effective trading strategies for the upside potential of this stock.
ASX: NST one-day chart (semilog scale) analysis
Function: Major trend (Intermediate degree, orange).
Mode: Motive.
Structure: Impulse.
Position: Wave 3-grey of Wave (3)-orange.
Details: I saw price action evidence that wave 2-grey ended as a Double Zigzag labeled ((w))((x))((y))-navy at the low of 15.06. And the subsequent push up also suggested that wave 3-grey was indeed moving higher, heading towards the nearest target at 20.00.
Invalidation point: 15.06.

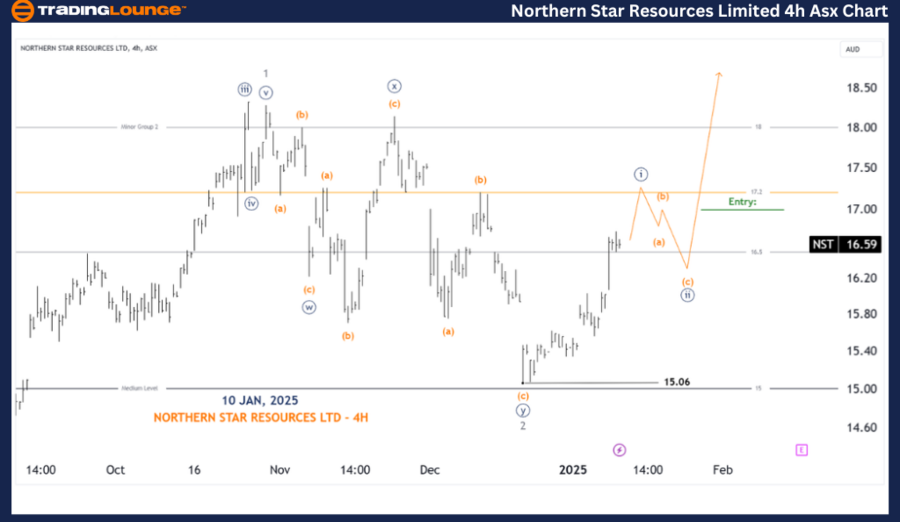
ASX: NST four-hour chart analysis
Function: Major trend (Minute degree, navy).
Mode: Motive.
Structure: Impulse.
Position: Wave ((i))-navy of Wave 3-grey.
Details: Looking more closely at wave 3-grey to look for a long trade setup, I see that wave ((i))-navy will soon complete, and we will have a pullback with wave ((ii)). That is the time to observe, analyze, and prepare for a long opportunity. And the most effective and safest long strategy is when the price pushes higher than the end point of wave (b)-orange of wave ((ii))-navy.
Invalidation point: 15.06.
Conclusion
Our analysis, forecast of contextual trends, and short-term outlook for ASX: NORTHERN STAR RESOURCES LTD – NST aim to provide readers with insights into the current market trends and how to capitalize on them effectively. We offer specific price points that act as validation or invalidation signals for our wave count, enhancing the confidence in our perspective. By combining these factors, we strive to offer readers the most objective and professional perspective on market trends.
Northern Star Resources Ltd analysis and Elliott Wave forecast [Video]
Author

Peter Mathers
TradingLounge
Peter Mathers started actively trading in 1982. He began his career at Hoei and Shoin, a Japanese futures trading company.


