NIO’s rally failed, Elliott Wave path shows more downside

Nio Inc. (NIO) is a Chinese multinational automobile manufacturer headquartered in Shanghai, specializing in designing and developing electric vehicles. The company develops battery- swapping stations for its vehicles, as an alternative to conventional charging stations. The company has raised over $5 billions from investors. In 2021, it plans to expand to 25 different countries and regions by 2025.
NIO Daily Chart June 2023
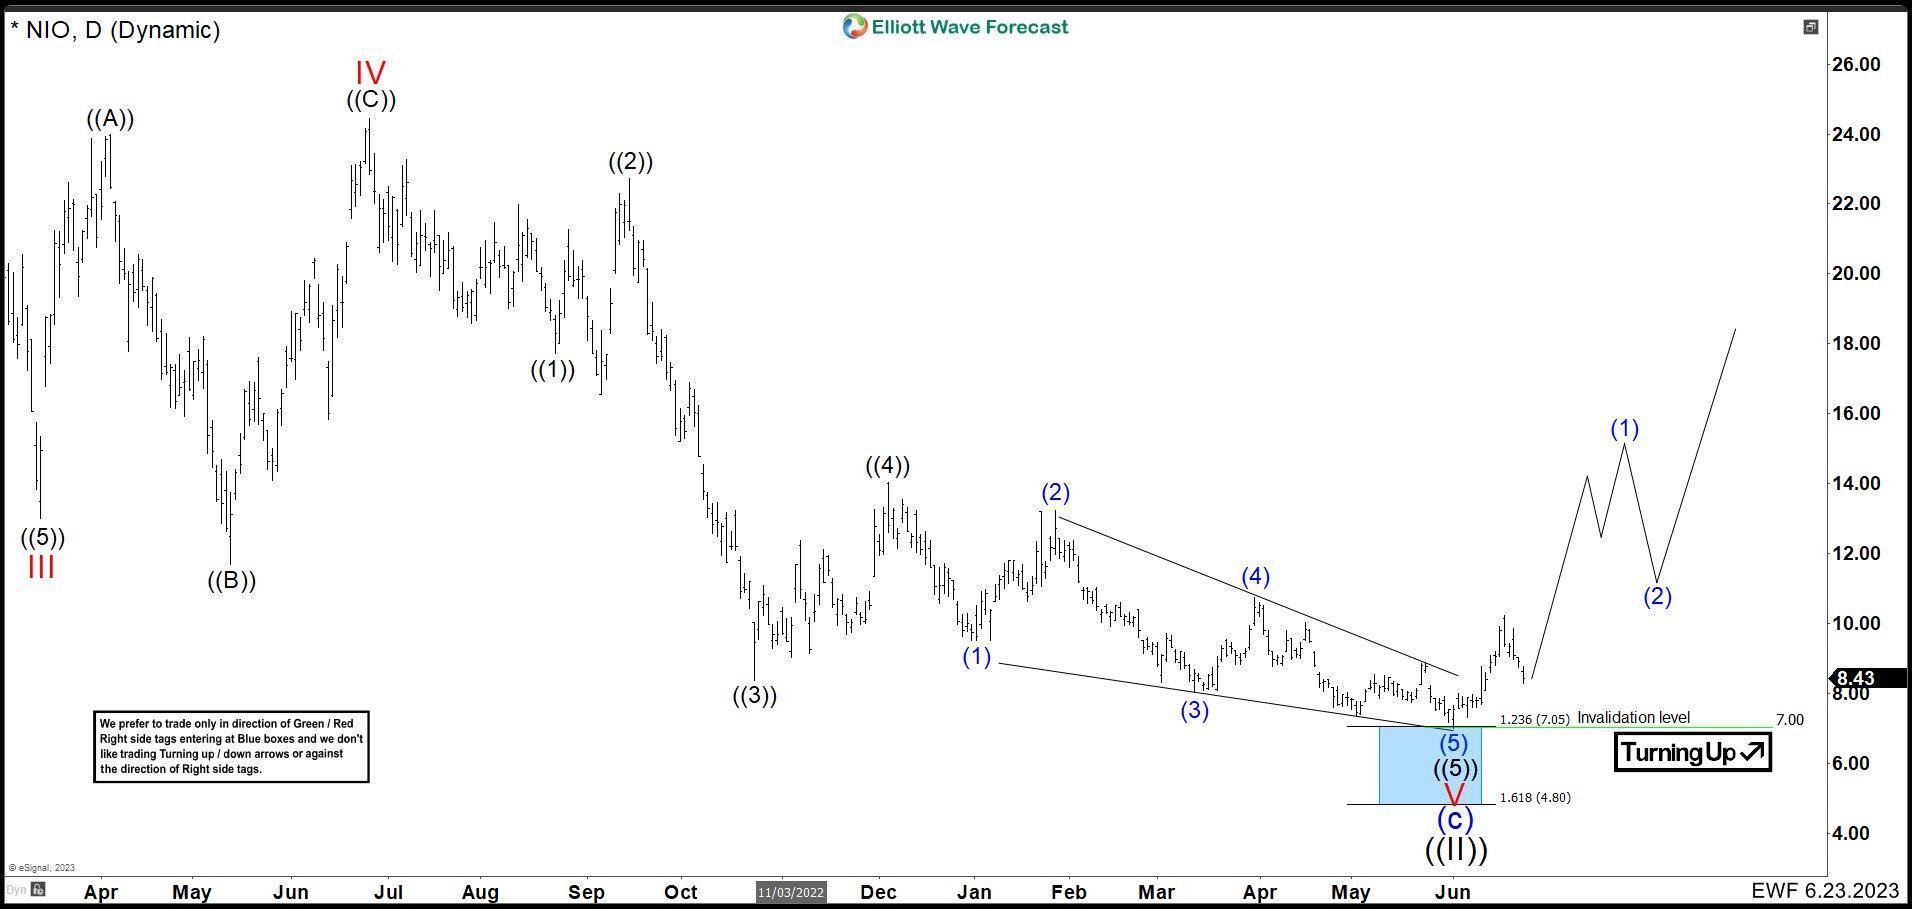
Months ago, we saw NIO had been falling since early days of 2021 and it seemed that the correction that we called as wave ((II)) had ended. The chart showed that the price action dropped reaching the blue box (7.05 – 4.80) at 7.00 and rallied. It given us the idea that the big cycle as wave ((II)) had ended and it should continue higher as price stays above 7.00.
NIO Daily Chart November 2023
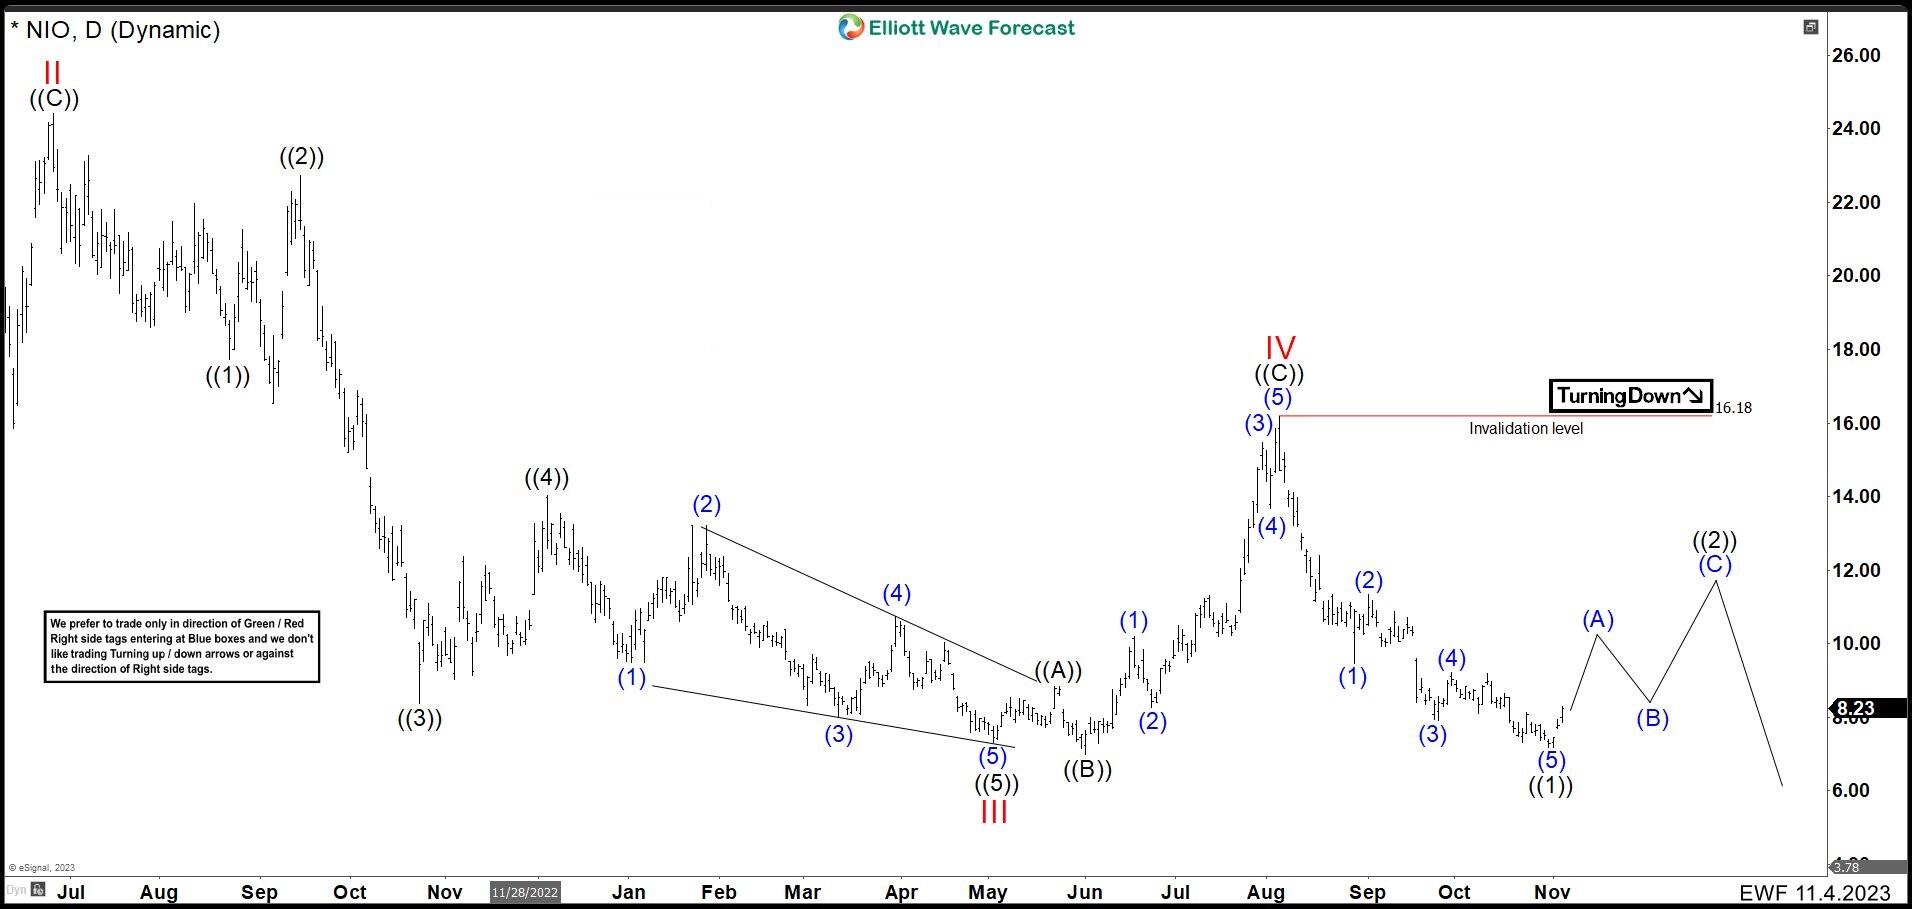
In the chart above, we can see how NIO made a nice rally from the blue box with more than 125% in profits. However, the pullback has been too deep. It still has not broken the low of 7.00, but with the market conditions it is more likely that is going to happen. That is why we adjusted the count and we called wave (c) in blue as an ending diagonal. Wave I of (c) ended at 11.67 low and wave II bounce finished at 24.43. We can see 5 waves down making the wave ((5)) of III an ending diagonal structure completing at 7.33 low. Then, took a part a 3-3-5 flat correction as wave IV ending at 16.18 high.
From 16.18 high, NIO made a strong move to the downside. Wave (1) of ((1)) ended at 9.46 low, then bounced making a zig zag structure finishing wave (2) at 11.35. The momentum continued sending the stock to 7.93 to complete wave (3). A small reaction higher ended wave (4) at 9.22 and continued lower to completed wave (5) of ((1)) at 7.18. This wave ((1)) is the wave ((1)) of V that at the same time is the wave V of (c) of ((II)). Currently, we are expecting to rally in 3, 7 or 11 swings correction to finish wave ((2)) before seeing further downside. The view is valid as price action stays below 16.18 high.
Author

Elliott Wave Forecast Team
ElliottWave-Forecast.com


