Nikkei 225 (N225) Elliott Wave technical analysis [Video]
![Nikkei 225 (N225) Elliott Wave technical analysis [Video]](https://editorial.fxstreet.com/images/Markets/Equities/DowJones/bloomberg-app-on-iphone-4-with-market-data-17118657_XtraLarge.jpg)
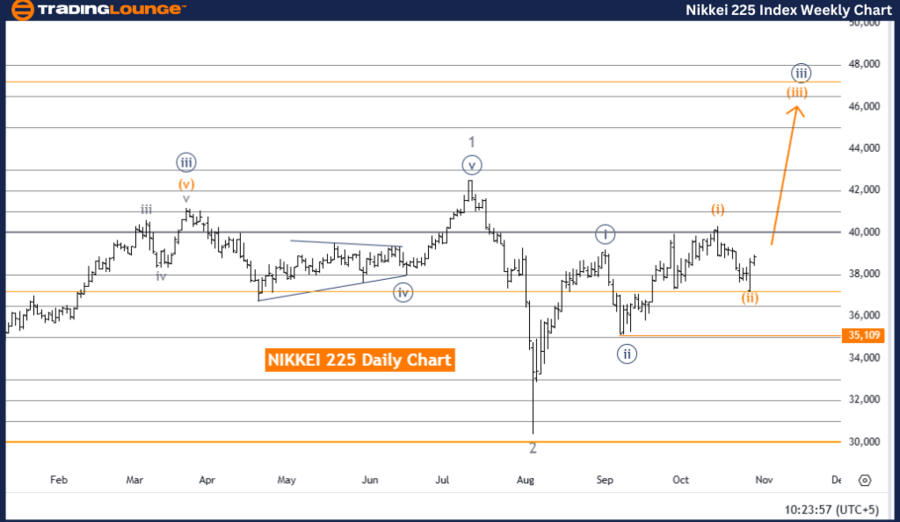
Nikkei 225 (N225) Elliott Wave Analysis - Trading Lounge Day Chart
Nikkei 225 (N225) Elliott Wave technical analysis
-
Function: Bullish Trend.
-
Mode: Impulsive.
-
Structure: Orange Wave 3.
-
Position: Navy Blue Wave 3.
-
Direction next higher degrees: Orange Wave 3 (Started).
-
Details: Orange wave 2 appears completed; orange wave 3 is now in progress.
-
Wave cancel invalid level: 35,109.
The daily Elliott Wave analysis for Nikkei 225 (N225) indicates a bullish trend supported by an impulsive mode in orange wave 3, which is part of the broader cycle in navy blue wave 3. This structure suggests the index is in an upward phase, with orange wave 3 actively progressing, expected to drive further gains as it advances within navy blue wave 3, confirming a continued bullish outlook.
Orange wave 3, characterized by its impulsive nature, aligns with a strong bullish sentiment, marking a robust upward movement for the Nikkei 225. The completion of the preceding orange wave 2 confirms the start of this new upward phase in orange wave 3, indicating a series of likely upward moves as the bullish trend progresses.
The next higher degree direction remains consistent with orange wave 3, which has just begun within the broader Elliott Wave sequence. As the trend persists, the Nikkei 225 is anticipated to move higher, with some minor corrections along the way, though the general movement is expected to remain upward.
A critical reference level is set at 35,109, serving as the invalidation point for the current wave structure. If the index falls below this level, it would invalidate the current bullish wave count, potentially indicating a change in trend. However, as long as the index remains above this level, the bullish wave structure is valid.
Summary: The daily chart analysis for the Nikkei 225 reflects a bullish trend within orange wave 3 of navy blue wave 3. With orange wave 3 underway and showing strong upward momentum, the analysis supports continued gains in the Nikkei, with 35,109 as the key level for wave cancellation to confirm the trend.
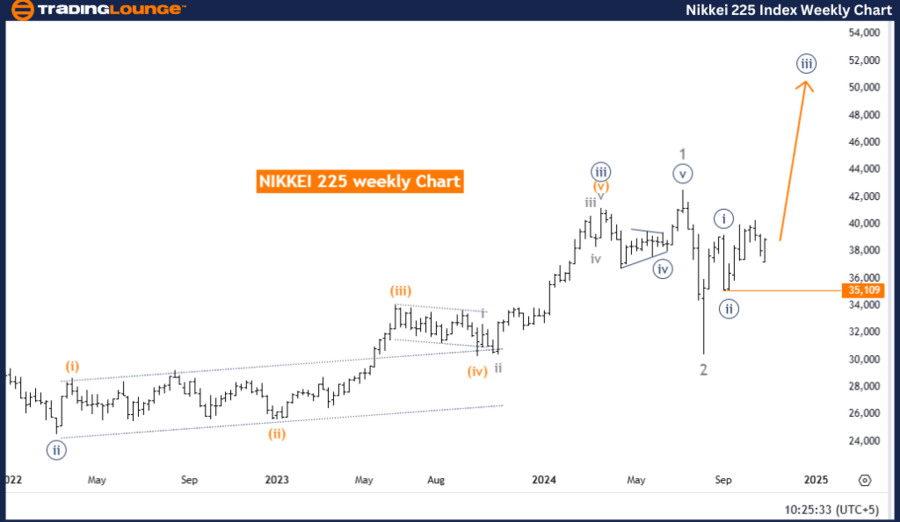
Nikkei 225 (N225) Elliott Wave Analysis - Trading Lounge Weekly Chart
Nikkei 225 (N225) Elliott Wave technical analysis
-
Function: Bullish Trend.
-
Mode: Impulsive.
-
Structure: Navy Blue Wave 3.
-
Position: Gray Wave 3.
-
Direction next higher degrees: Navy Blue Wave 3 (Continuing).
-
Details: Navy Blue Wave 2 appears complete; Navy Blue Wave 3 is now in play.
-
Wave cancel invalid level: 35,109.
The weekly Elliott Wave analysis for the Nikkei 225 (N225) reflects a bullish trend, marked by an impulsive structure currently in navy blue wave 3, which is part of the broader gray wave 3. This wave structure suggests sustained upward momentum, as navy blue wave 3 remains active, building on the completed navy blue wave 2.
With navy blue wave 3 underway, this phase signifies a notable and vigorous upward movement within the Elliott Wave cycle, supporting a strong bullish outlook for the Nikkei 225. The impulsive nature of navy blue wave 3 suggests the current rally will likely see further gains, characterized by a pattern of higher highs and higher lows, reinforcing the bullish market sentiment.
The next higher degree direction remains consistent with the ongoing upward movement of navy blue wave 3, indicating a positive trajectory within the current wave structure. This aligns with a long-term bullish trend in the Nikkei 225 as gray wave 3 progresses.
The critical reference level for this structure is set at 35,109, which acts as the invalidation threshold. If prices fall below this level, it would invalidate the current Elliott Wave count, suggesting a potential reevaluation of the trend. However, as long as prices stay above this level, the bullish wave count remains valid, supporting the ongoing upward trend.
Summary: The weekly analysis of Nikkei 225 shows a strong bullish trend within navy blue wave 3, positioned in gray wave 3, with navy blue wave 3 expected to continue advancing. This ongoing trend remains valid as long as levels stay above 35,109, indicating further gains as the bullish Elliott Wave structure persists.
Technical analyst: Malik Awais.
Nikkei 225 (N225) Elliott Wave technical analysis [Video]
Author

Peter Mathers
TradingLounge
Peter Mathers started actively trading in 1982. He began his career at Hoei and Shoin, a Japanese futures trading company.


