Nike stock sinks to five-year low as hot inflation print takes its toll on sputtering market
- Management expects revenue to cave by the mid-teens in the present quarter.
- NKE stock trades to low $60s, levels last seen during the covid sell-off in March 2020.
- Higher core PCE inflation could mean a longer wait for interest rate cuts.
- A break below $60 would place NKE at prices not seen since 2017.

Nike (NKE) stock reached a five-year low on Friday as the stock sank more than 3% to an intraday low beneath $63.50. The share price has been trending lower over the past week and a half due to management signaling a weak outlook ahead, but things were exacerbated by the latest inflation print arriving above consensus.
On Friday morning, the core Personal Consumption Expenditures (PCE) reading for February showed inflation rise to 2.8% YoY, and January’s reading was revised up by a tenth of a point to 2.7%. The monthly core reading rose by a tenth to 0.4% as well. This was bad news for a market searching for progress on the inflation front in order to clear the way for interest rate cuts from the Federal Reserve (Fed).
This sent the market shivering, and the Dow Jones Industrial Average (DJIA), which includes Nike, traded 1.7% lower by the early afternoon. The NASDAQ was even worse with a 2.7% slide. For its part, Amazon (AMZN), also a member of the Dow Jones index, slumped 4.4%.
Even worse, the Atlanta Fed's GDPNow indicator showed an estimated GDP growth figure of 2.8% for Q1. Before Friday, it had been -1.8%.
Nike stock news
The Trump administration’s push for tariffs has placed Nike and other apparel makers in a weak spot. The global apparel industry sources the bulk of its production in emerging markets and developing nations where wages are lower. There is no simple way to produce US apparel in the US in order to circumvent tariffs without raising prices drastically, so Nike and others are expecting to see demand dry up as tariffs go into effect.
Additionally, the tariffs are likely to reduce the value of the US Dollar while making foreign currencies stronger, which Nike also views as a headwind for the bottom line.
Much of the new worldwide tariffs are expected to be announced next Wednesday, April 2, a day that the White House is calling Liberation Day.
Nike has the second lowest oversold reading on the Relative Strength Index (RSI) among S&P 500 stocks. Its 28 reading is only surpassed by Gartner (IT).
The stock has fared poorly since the earnings call on March 20, when management said they were expecting revenue to decline by a mid-teens figure on an annual basis in the current quarter, fiscal Q4. The most recent past quarter, Q3, saw a revenue decline of 9%.
Nike also said that gross margins are likely to plummet by as much as 500 basis points. This will push the consensus for adjusted earnings per share (EPS) from $1.01 a year earlier to just $0.12 in Q4.
Nike stock forecast
Nike shares are so far under the 200-day Simple Moving Average (SMA) up at $78 that it would seem the current price level is likely to be the new normal. Shares are trading near the covid low of $60. Any break below that big round figure would send the stock price to a level not seen since late 2017, nearly eight years ago.
As luck would have it, though, the next Fibonacci Retracement level, the 161.8% line, sits just above $60. This might then be the bottom. However, a break below $60 would place the next Fibo support, the 261.8% level, all the way down at $46.26.
To achieve stability, Nike needs to retake the $71 level before taking aim at the 200-day SMA.
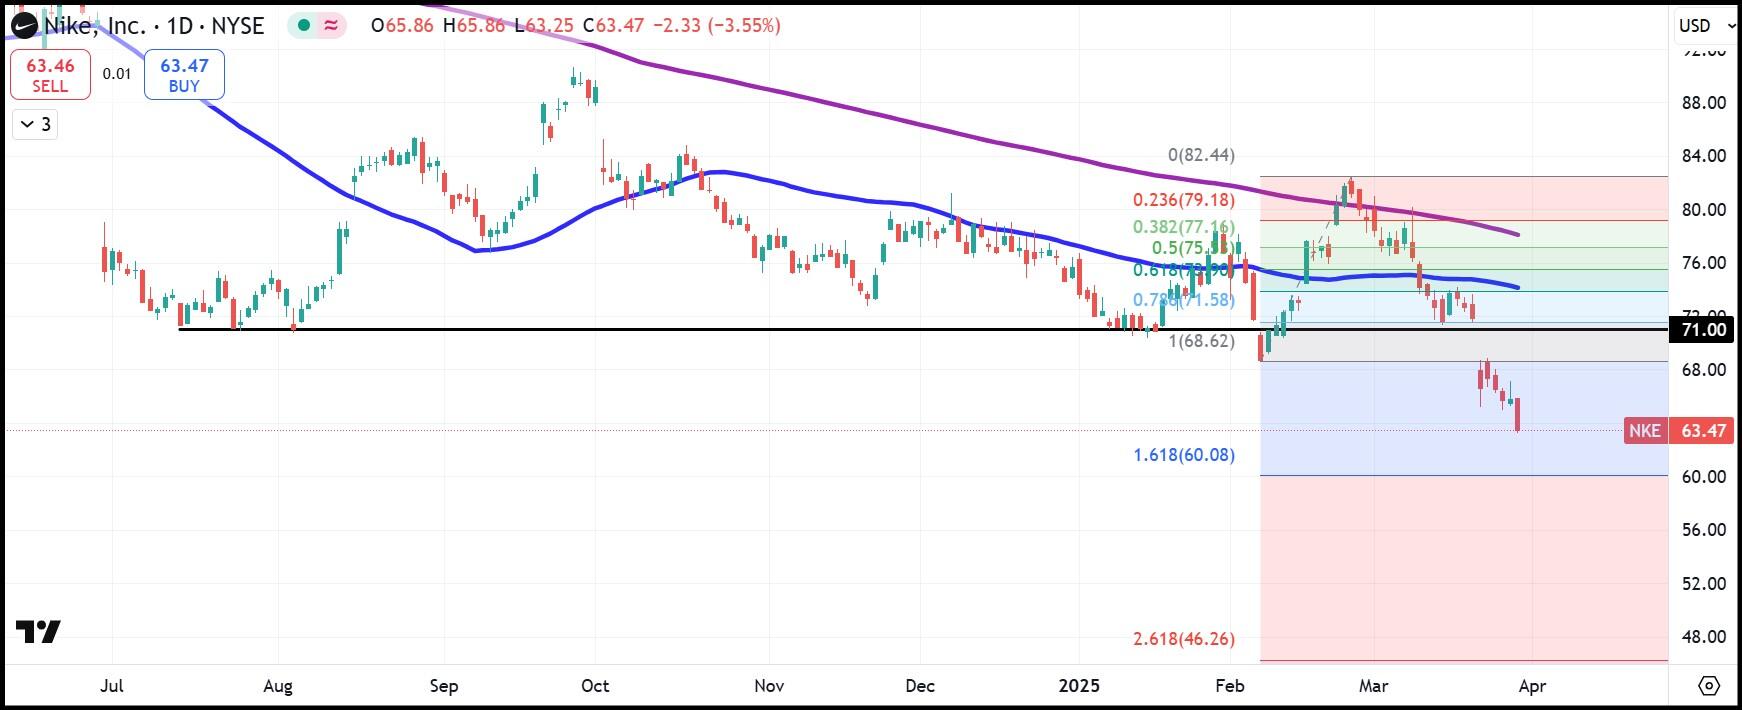
NKE daily stock chart
Author

Clay Webster
FXStreet
Clay Webster grew up in the US outside Buffalo, New York and Lancaster, Pennsylvania. He began investing after college following the 2008 financial crisis.


