Dow Jones Industrial Average falls further on fresh inflation, tariff, and recession fears
- The Dow Jones plummeted over 700 points on Friday.
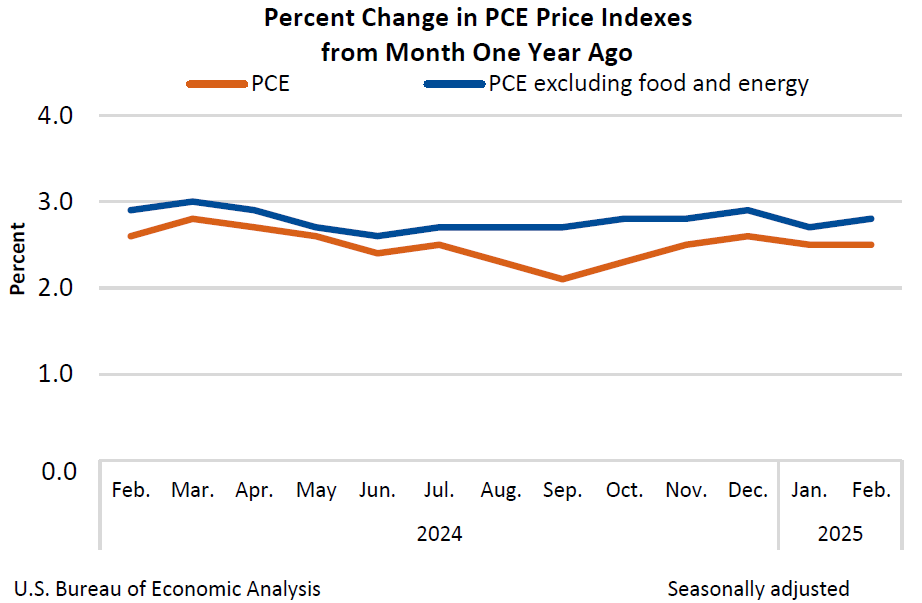
- Investor sentiment is deteriorating after key PCE inflation metrics ticked higher.
- Ongoing tariff fears and souring consumer sentiment are also pushing stocks lower.


The Dow Jones Industrial Average (DJIA) backslid over 700 points on Friday, falling 1.75% and tumbling to 41,500 after core Personal Consumption Expenditure (PCE) inflation figures accelerated in February. Consumer inflation fears rose in March, and the consumer outlook on economic conditions also deteriorated further as tariff fears continue to take a bite out of general sentiment.
Core PCE Price Index inflation ticked up to 2.8% YoY in February as inflation pressures continue to flash warning signs that it will take longer for the Federal (Reserve) to achieve 2% inflation than previously thought. PCE inflation has functionally remained flat for a nine-month stretch, with monthly releases holding steady above 2.6% YoY since June of last year.
The University of Michigan (UoM) Consumer Sentiment Index crumpled to its lowest levels in over two years, falling to 57.0 compared to the expected flat hold at 57.9. UoM 1-year Consumer Inflation Expectations rose again, climbing to 5.0%. UoM Consumer 5-year Inflation Expectations also lifted to 4.1% versus the forecast of 3.9%. Median market forecasts widely expected consumer sentiment to remain flat in February as investors horribly misjudge how beleaguered US consumers are getting in the face of the Trump administration’s self-styled trade war. Despite President Donald Trump’s insistence that sweeping tariffs, set to take effect on April 2, will be good for the US, consumers are growing increasingly concerned that economic conditions are going to continue deteriorating and inflation will continue to rise.
President Trump reiterated on Friday that he will still enact a wide slew of tariffs on April 2, a day he continues to try and label Liberation Day. The Trump administration is promising to kick off a 25% tariff on all automobiles not produced in the US, as well as “reciprocal” tariffs on every country that has defensive tariffs on US goods. The Trump administration also plans to add further flat import taxes on items ranging from Copper, to microchips, and pharmaceuticals, as well as additional revenge tariffs of 20% on any country that also purchases Venezuelan Crude Oil.
Stock news
Equity indexes are down across the board on Friday. The Dow Jones fell over 700 points to 41,500, with the Standard & Poor’s 500 index backsliding 115 points to decline 2% on the day. The Nasdaq Composite tech index and shed weight, falling around 500 points to lose 2.7% from Friday’s opening bids.
Dow Jones price forecast
A fresh bout of selling has dragged the Dow Jones Industrial Average back below the 200-day Exponential Moving Average (EMA) near the 42,000 major handle. Price action is paring away recent gains after the Dow Jones’ last downturn, which dragged the index below 40,800.
The DJIA briefly recovered to the 42,800 region this week, but momentum has quickly turned lower once again, with the Dow Jones declining 3% top-to-bottom over a three-day period. Unless bullish momentum returns, the DJIA is poised for a fresh challenge of the 41,000 key level.
Dow Jones daily chart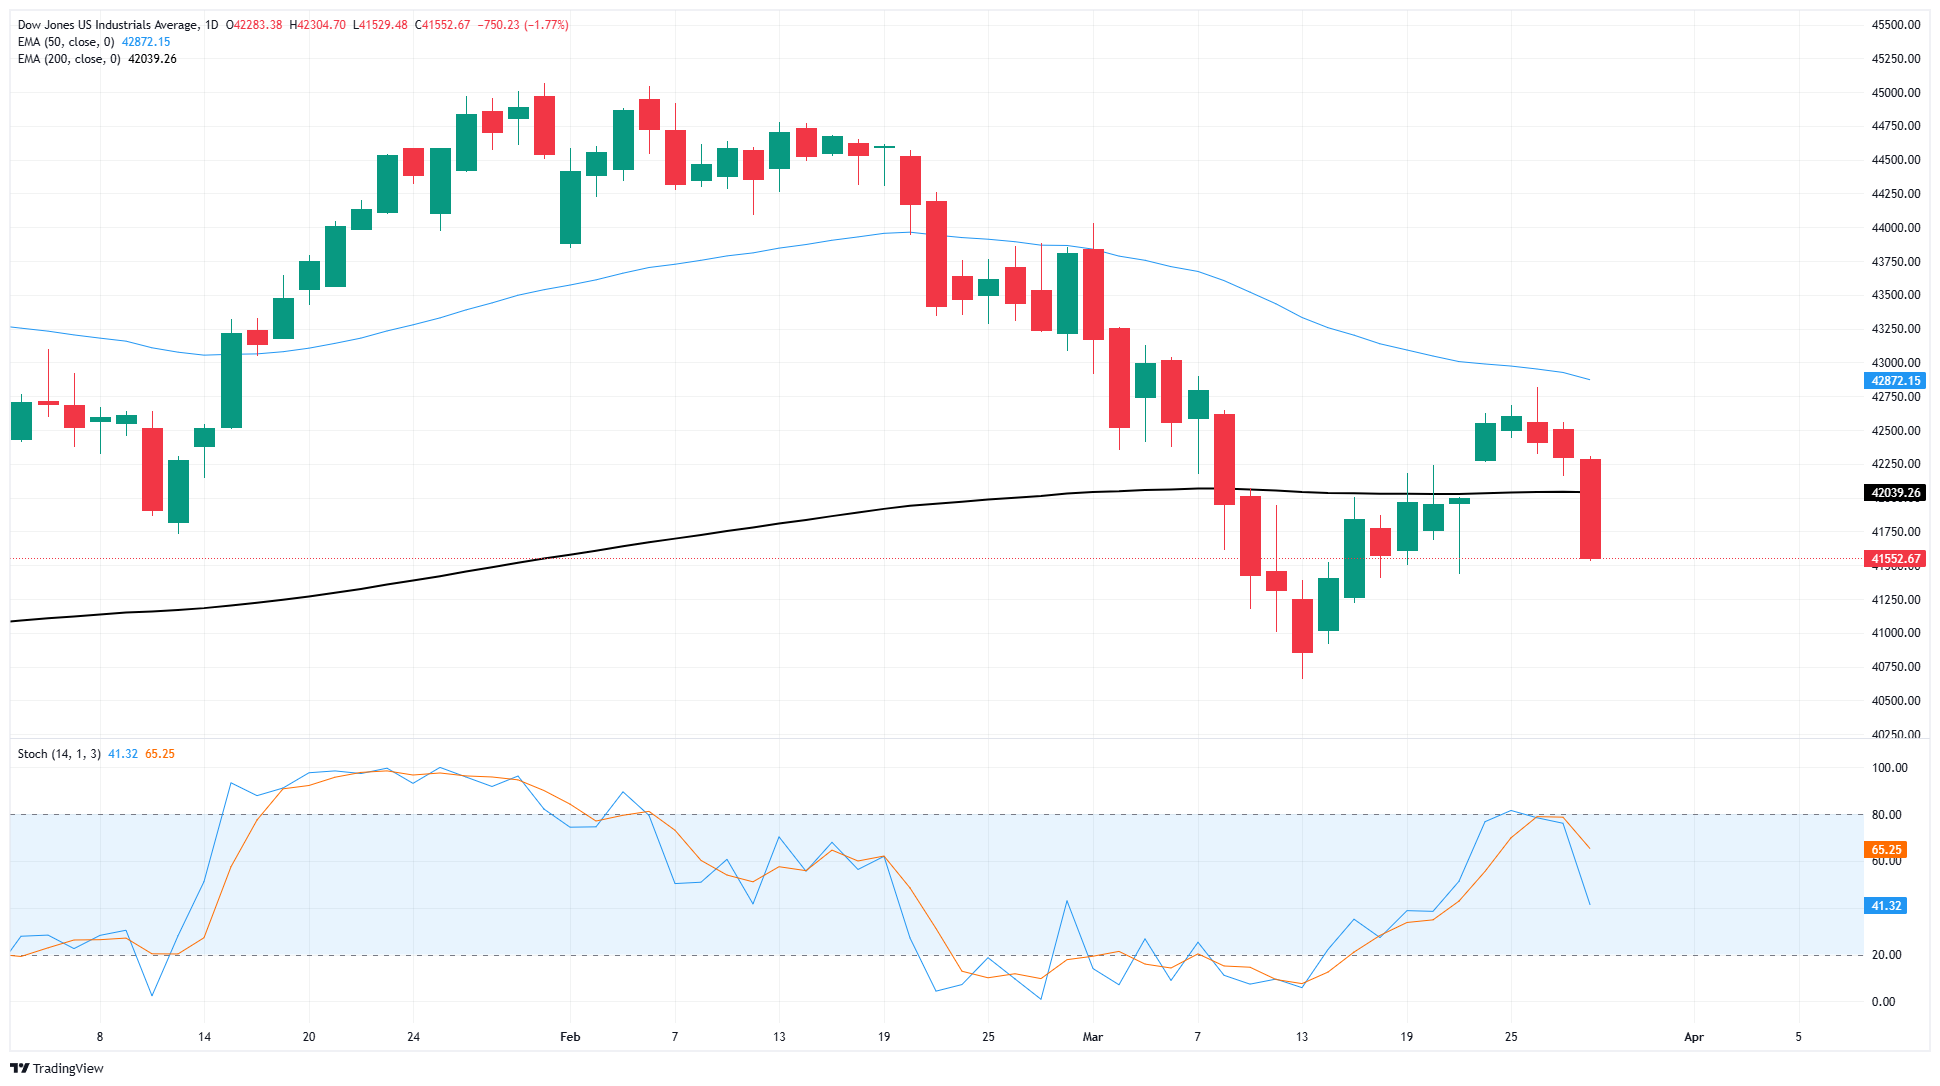
Economic Indicator
Core Personal Consumption Expenditures - Price Index (YoY)
The Core Personal Consumption Expenditures (PCE), released by the US Bureau of Economic Analysis on a monthly basis, measures the changes in the prices of goods and services purchased by consumers in the United States (US). The PCE Price Index is also the Federal Reserve’s (Fed) preferred gauge of inflation. The YoY reading compares the prices of goods in the reference month to the same month a year earlier. The core reading excludes the so-called more volatile food and energy components to give a more accurate measurement of price pressures." Generally, a high reading is bullish for the US Dollar (USD), while a low reading is bearish.
Read more.Last release: Fri Mar 28, 2025 12:30
Frequency: Monthly
Actual: 2.8%
Consensus: 2.7%
Previous: 2.6%
Source: US Bureau of Economic Analysis
After publishing the GDP report, the US Bureau of Economic Analysis releases the Personal Consumption Expenditures (PCE) Price Index data alongside the monthly changes in Personal Spending and Personal Income. FOMC policymakers use the annual Core PCE Price Index, which excludes volatile food and energy prices, as their primary gauge of inflation. A stronger-than-expected reading could help the USD outperform its rivals as it would hint at a possible hawkish shift in the Fed’s forward guidance and vice versa.
Author
Joshua Gibson
FXStreet
Joshua joins the FXStreet team as an Economics and Finance double major from Vancouver Island University with twelve years' experience as an independent trader focusing on technical analysis.

















