NIFTY 50 (India) Elliott Wave technical analysis [Video]
![NIFTY 50 (India) Elliott Wave technical analysis [Video]](https://editorial.fxstreet.com/images/i/bullish-chart_XtraLarge.png)
NIFTY 50 (INDIA) Elliott Wave technical analysis
-
Function: Bullish Trend.
-
Mode: Impulsive.
-
Structure: Navy Blue Wave 1.
-
Position: Gray Wave 1.
-
Direction next higher degrees: Navy Blue Wave 1 (Started).
Details:
-
Orange Wave 4 appears completed.
-
Navy Blue Wave 1 of 1 is now in play as a new uptrend.
-
Wave Cancel Invalidation Level: 22,740.5
Market overview
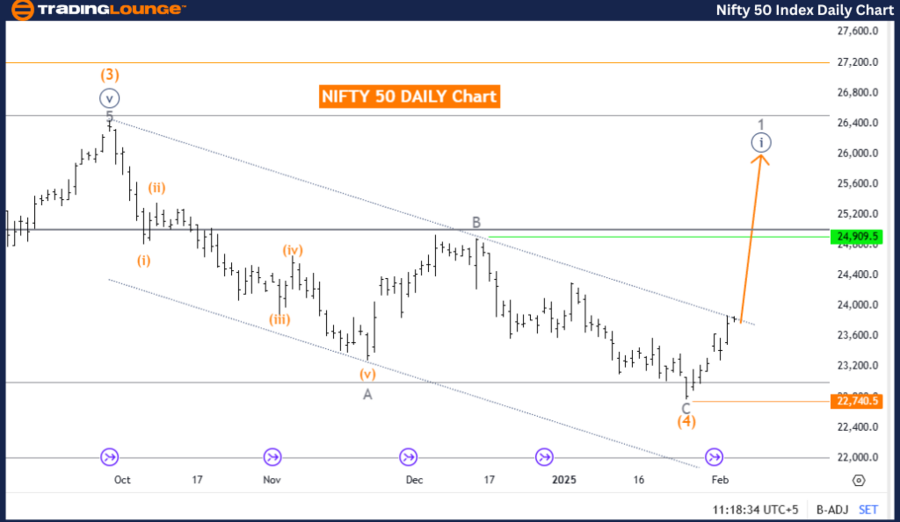
The NIFTY 50 India daily chart, based on Elliott Wave Theory, indicates a bullish trend in an impulsive mode. The current wave structure focuses on Navy Blue Wave 1, which has recently started, marking the beginning of a potential long-term uptrend. This development is a key phase in the market's wave cycle, with Gray Wave 1 currently active.
The analysis suggests that Orange Wave 4 has been completed, allowing the formation of Navy Blue Wave 1 of 1, signaling renewed market momentum and the possibility of further price gains in the upcoming sessions.
Technical insights
The confirmation of Navy Blue Wave 1 as a new uptrend strengthens the market outlook and underscores the bullish sentiment. Market participants should closely monitor price action and key levels to validate this bullish scenario.
The wave cancel invalidation level is set at 22,740.5, meaning that a drop below this level would invalidate the current wave count and require a reassessment of the market outlook.
Conclusion
The NIFTY 50 daily chart suggests a bullish forecast, with Navy Blue Wave 1 of 1 unfolding as part of a new uptrend. The completion of Orange Wave 4 establishes a solid foundation for further price increases.
Traders and investors should remain attentive to price movements, watching for continued upward momentum while being mindful of the invalidation level to confirm or adjust trading strategies based on market conditions.
Day chart
NIFTY 50 (INDIA) Elliott Wave Technical Analysis
-
Function: Bullish Trend.
-
Mode: Impulsive.
-
Structure: Gray Wave 1.
-
Position: Orange Wave 5.
-
Direction next higher degrees: Gray Wave 1 (Started).
Details:
-
Orange Wave 4 appears completed.
-
Gray Wave 1 of 5 is now in play as a new uptrend.
-
Wave cancel invalidation level: 22,740.5.
Market overview
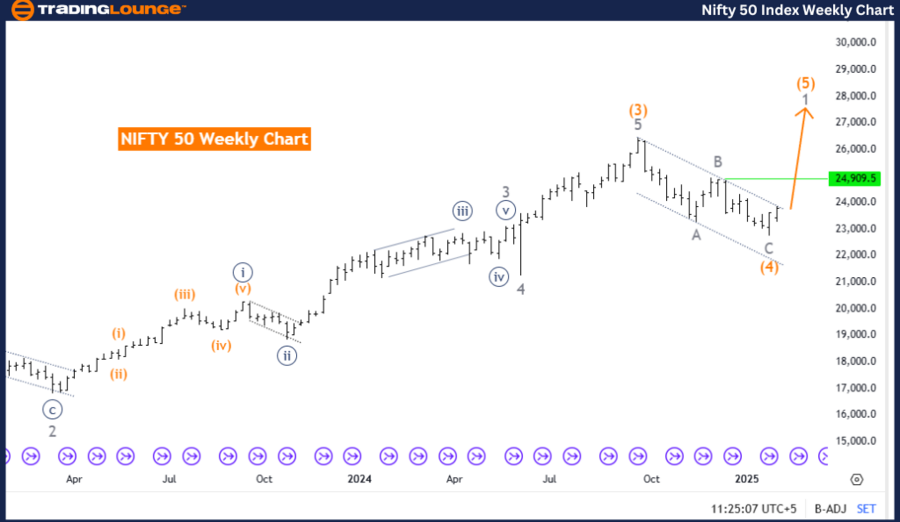
The NIFTY 50 weekly chart, based on Elliott Wave Theory, confirms a bullish trend in an impulsive mode. The current wave structure centers around Gray Wave 1, which has recently started, marking the beginning of a potential long-term uptrend. This development is a crucial phase in the market's wave cycle, with Orange Wave 5 currently positioned.
The analysis suggests that Orange Wave 4 has been completed, allowing the formation of Gray Wave 1 of 5, indicating renewed market momentum and further price gains. The start of Gray Wave 1 confirms market strength and provides a solid foundation for continued positive movement in the upcoming trading sessions.
Technical insights
The wave cancel invalidation level is set at 22,740.5, serving as a critical reference point for traders. Any decline below this level would invalidate the current wave count, requiring a reassessment of market dynamics.
Conclusion
The NIFTY 50 weekly chart presents a bullish outlook, with Gray Wave 1 of 5 actively unfolding as part of a new uptrend. The completion of Orange Wave 4 provides a strong base for further upside movement.
Market participants should closely track price action and key levels to confirm the continuation of the bullish trend while staying mindful of the critical invalidation level to adjust trading strategies accordingly.
Weekly chart
NIFTY 50 (India) Elliott Wave technical analysis [Video]
Author

Peter Mathers
TradingLounge
Peter Mathers started actively trading in 1982. He began his career at Hoei and Shoin, a Japanese futures trading company.


